Spatial Data, Part 3: Getting Around

This is part three in a series:

Now that we have some local buildings represented in our database, let’s move around.

Getting Around

0. Get the Buildings

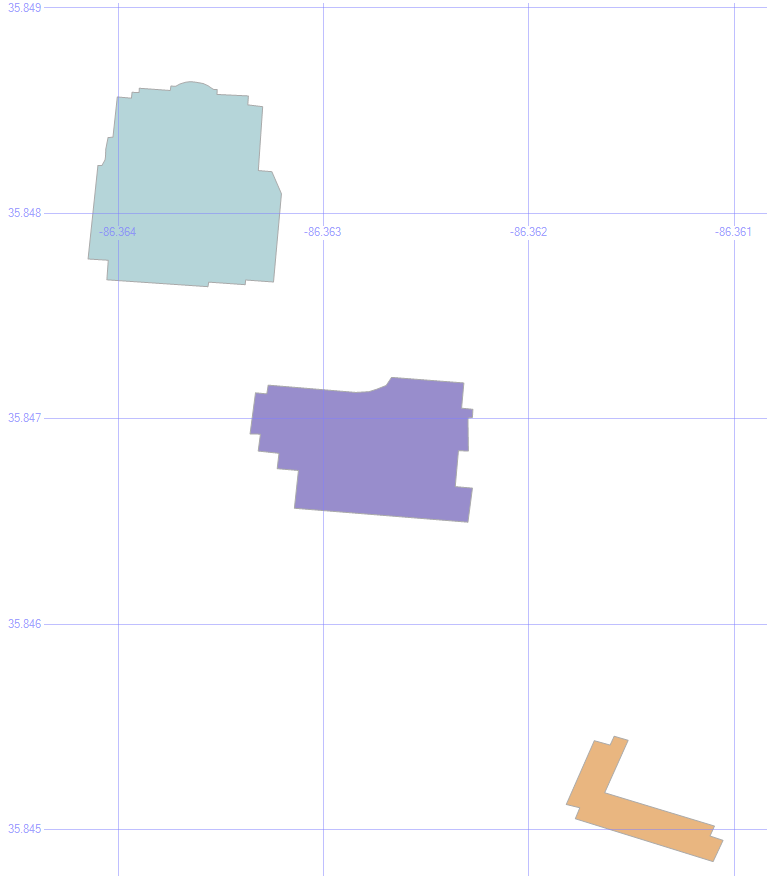
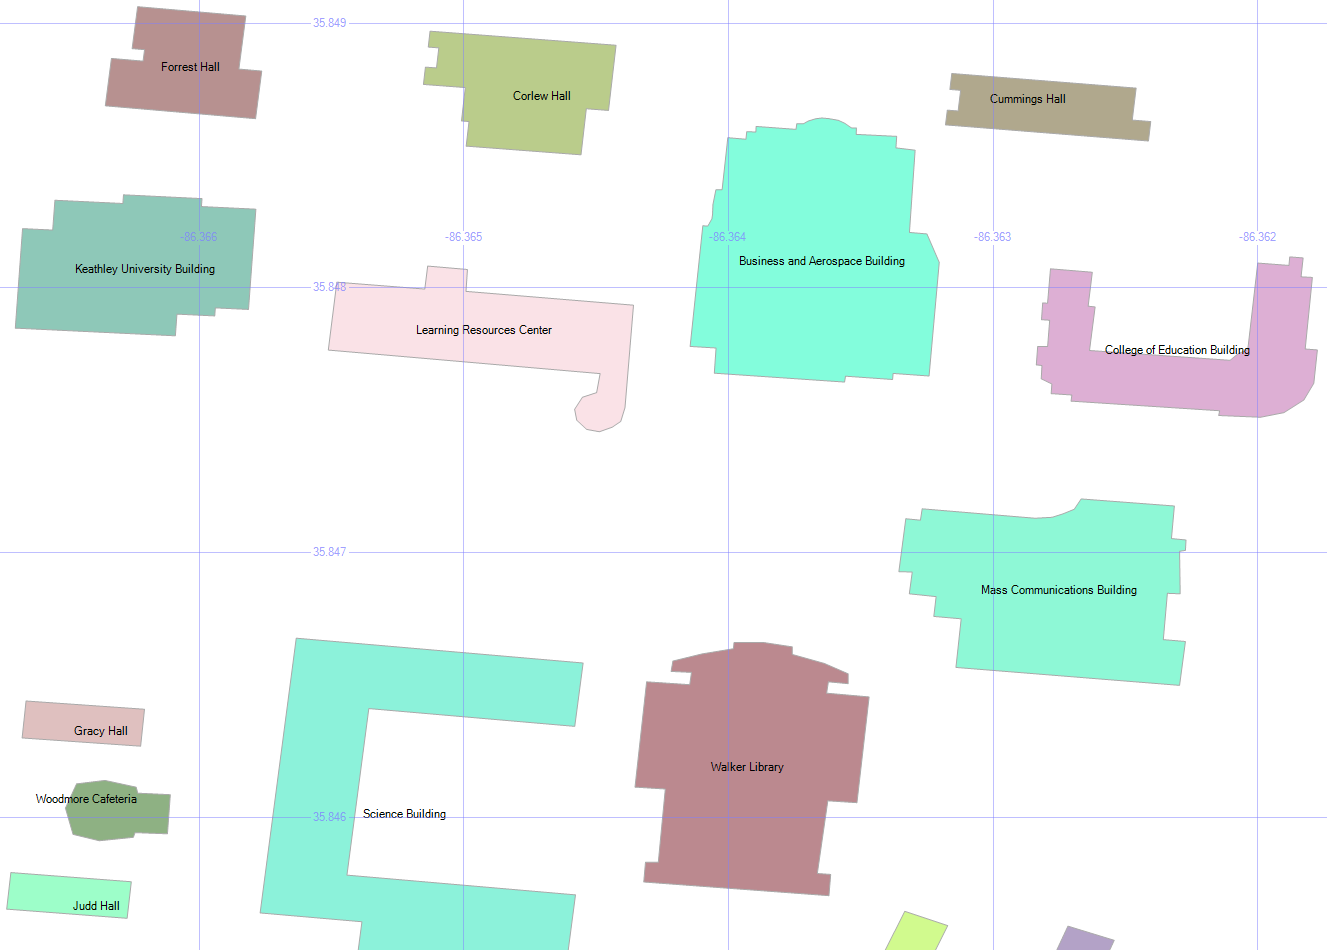
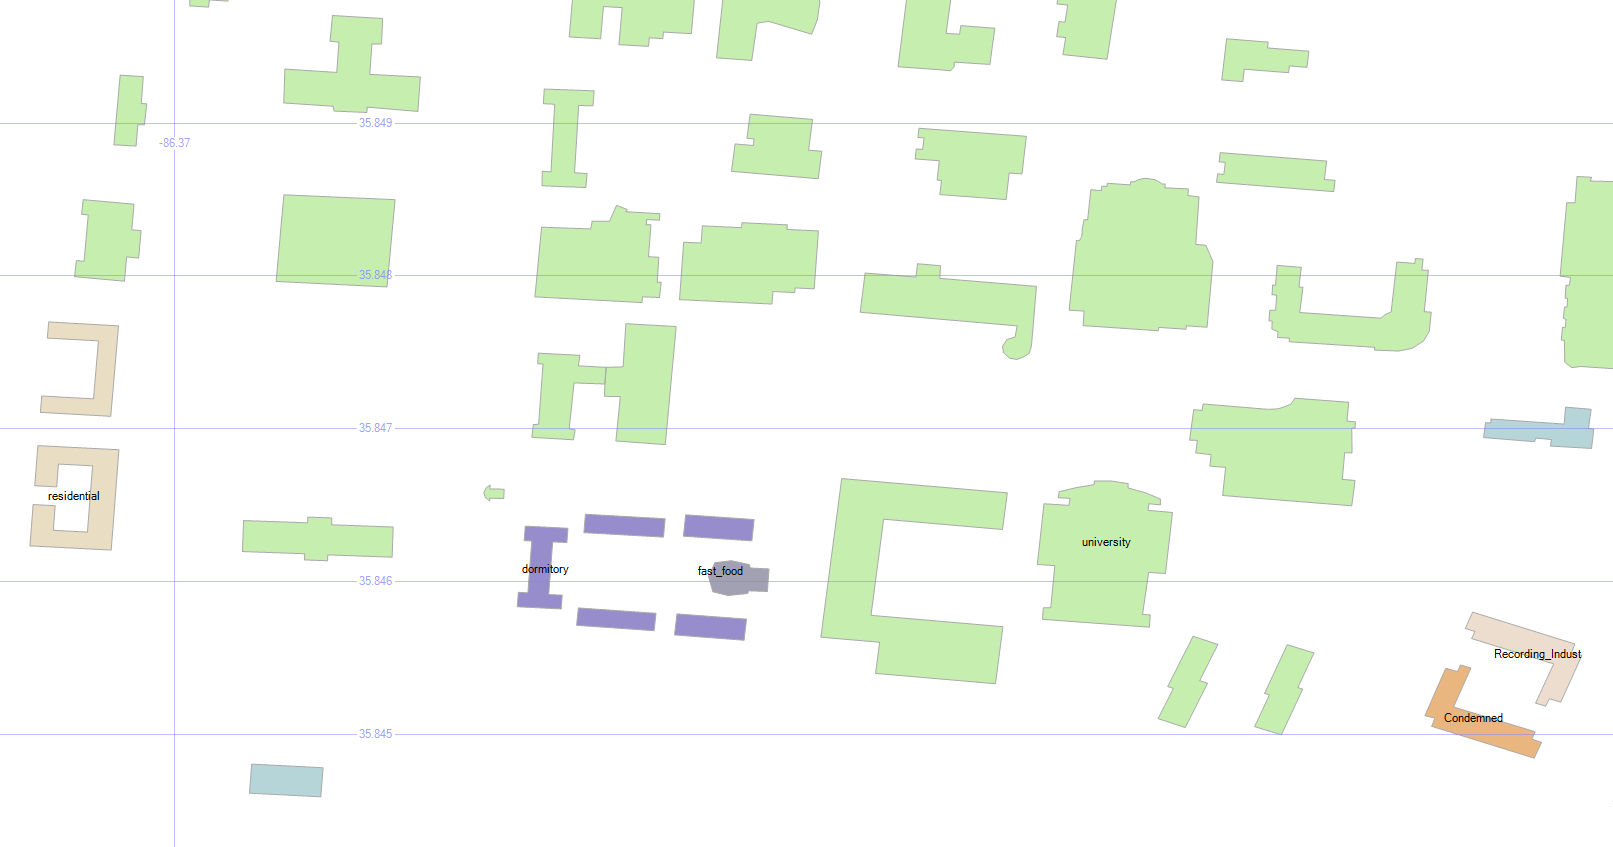
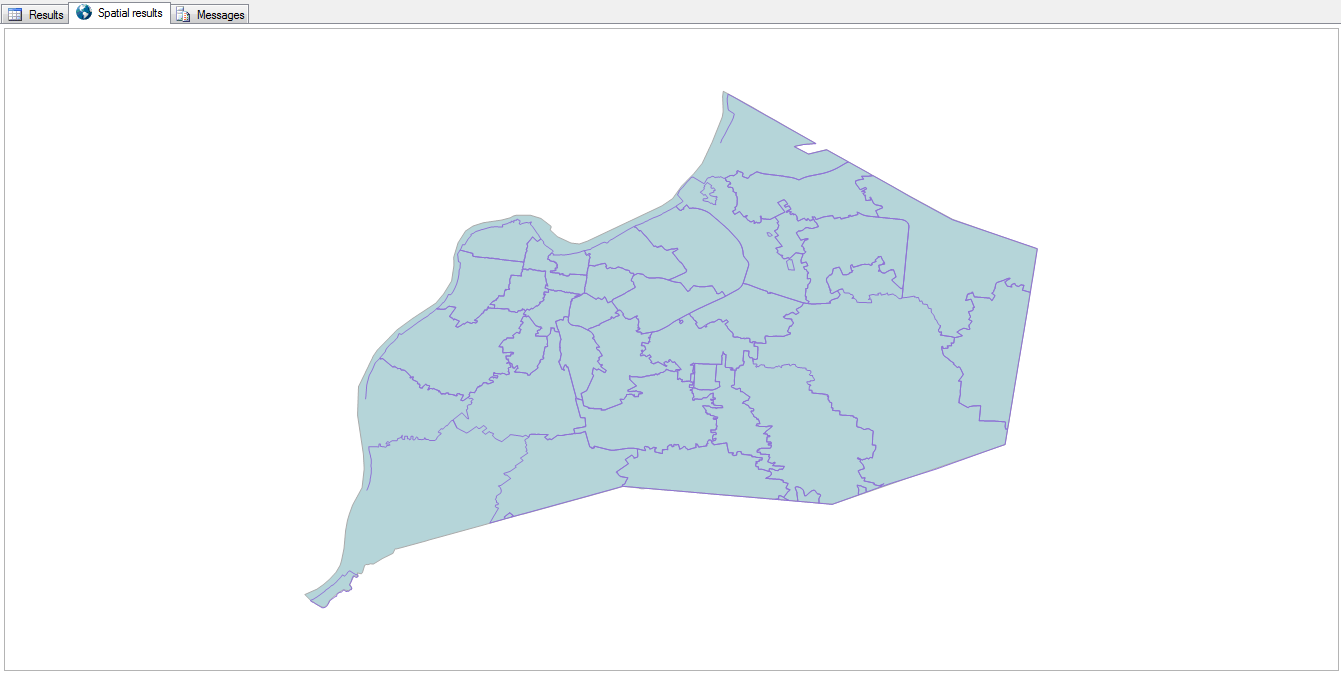
In the last step of Part 2, we saved three buildings into temp tables — #orig, #bloc, and #dest.

MSTU Buildings

1. Shortest Path

select geom from #orig union all select geom from #dest union all select geom from #bloc union all
select (select geom from #orig).ShortestLineTo((select geom from #dest))

Let’s Find the Shortest Path to that Condemned Building.

The .ShortestLineTo method will find the shortest path, even taking into account the shapes of the buildings.

Shortest Line

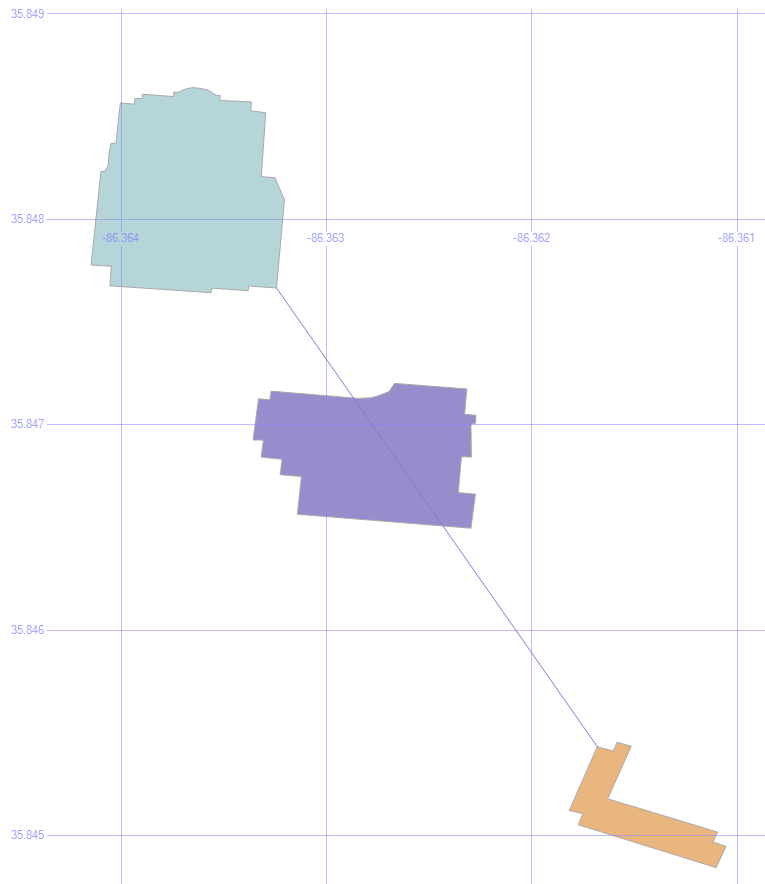
But it doesn’t care about any obstacles in its path, which is why we also stored that blocking building to continue our experiment.

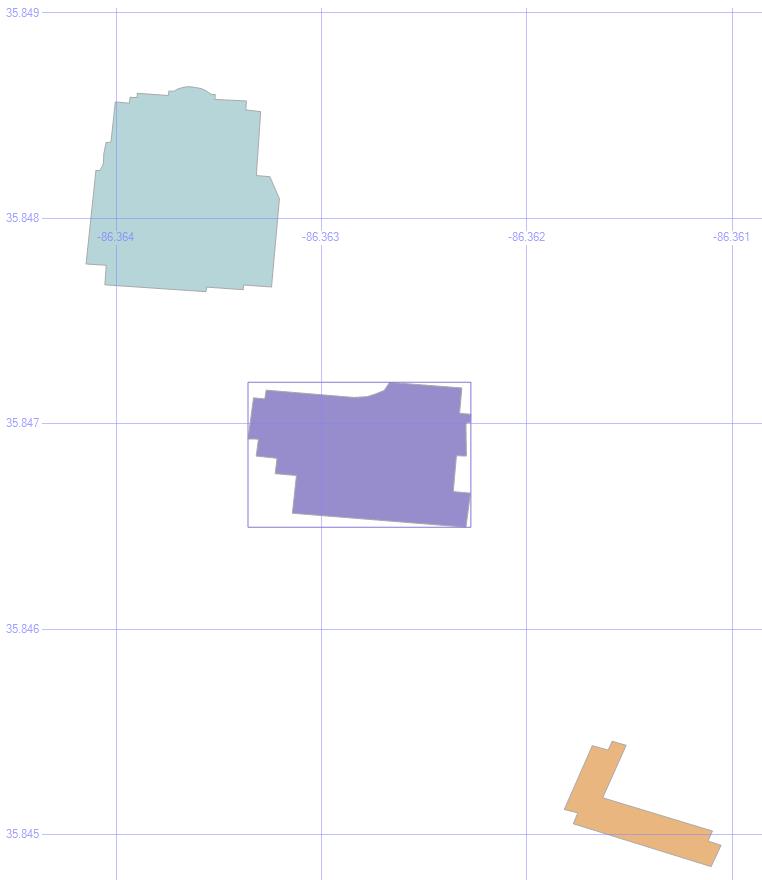
2. Put an Envelope on the Obstacle

select (select geom from #bloc).STEnvelope().STBoundary()
union all select geom from #orig union all select geom from #dest union all select geom from #bloc

An envelope will look at the highest and lowest values for the height and the width of an object, and draw a box using those values. We can use this to help find a path around the obstacle.

Envelope

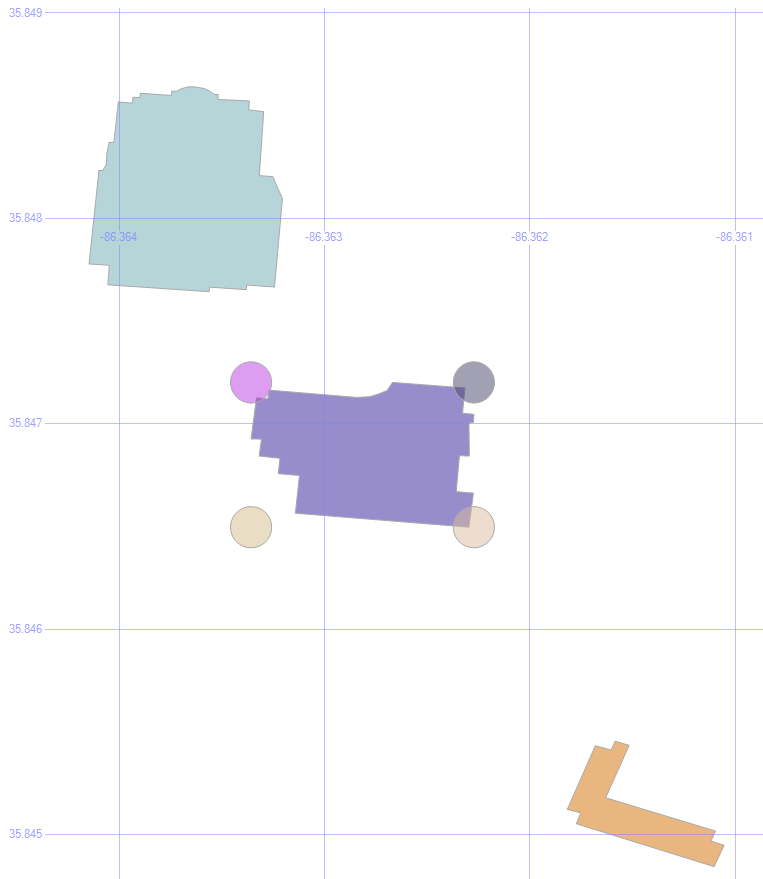
3. Draw the Corners of the Envelope

select geom from #orig union all select geom from #dest union all select geom from #bloc union all
select geometry::Point((select geom from #bloc).STEnvelope().STPointN((1)).STX, (select geom from #bloc).STEnvelope().STPointN((3)).STY, 0).STBuffer(.0001) union all
select geometry::Point((select geom from #bloc).STEnvelope().STPointN((3)).STX, (select geom from #bloc).STEnvelope().STPointN((3)).STY, 0).STBuffer(.0001) union all
select geometry::Point((select geom from #bloc).STEnvelope().STPointN((3)).STX, (select geom from #bloc).STEnvelope().STPointN((1)).STY, 0).STBuffer(.0001) union all
select geometry::Point((select geom from #bloc).STEnvelope().STPointN((1)).STX, (select geom from #bloc).STEnvelope().STPointN((1)).STY, 0).STBuffer(.0001)

This command illustrates where the corners of that envelope are. After all, we don’t really want the entire envelope to find a way around the obstacle, just the endpoints.

Envelope Corners

4. Save Those Corners

if object_id('tempdb.dbo.#corn', 'u') is not null drop table #corn create table #corn (geom geometry)
insert into #corn
select geometry::Point(geom.STEnvelope().STPointN((1)).STX, geom.STEnvelope().STPointN((3)).STY, 0) from #bloc
union all
select geometry::Point(geom.STEnvelope().STPointN((3)).STX, geom.STEnvelope().STPointN((3)).STY, 0) from #bloc
union all
select geometry::Point(geom.STEnvelope().STPointN((3)).STX, geom.STEnvelope().STPointN((1)).STY, 0) from #bloc
union all
select geometry::Point(geom.STEnvelope().STPointN((1)).STX, geom.STEnvelope().STPointN((1)).STY, 0) from #bloc

Let’s save those into some temp tables, too, to make the following statements a bit easier to read.

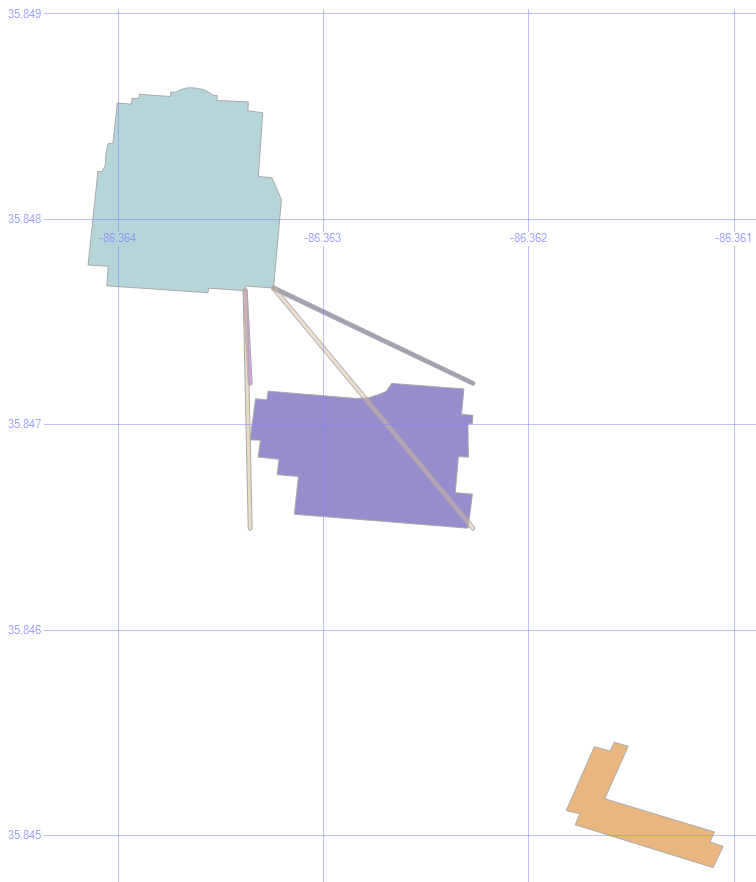
5. Paths to the Corners

select geom from #orig union all select geom from #dest union all select geom from #bloc union all
select o.geom.ShortestLineTo(c.geom).STBuffer(.00001) from #orig o left outer join #corn c on 1=1

Being a method, the .ShortestLineTo can be applied to as many shapes (or points) that we want to give it, all in a single command.

By putting the corners into a temp table, we can draw all four lines at once.

Origin Paths

6. Eliminate Overlaps

select geom from #orig union all select geom from #dest union all select geom from #bloc union all
select o.geom.ShortestLineTo(c.geom).STBuffer(.00001)
from #orig o left outer join #corn c on 1=1 left outer join #bloc b on 1=1
where o.geom.ShortestLineTo(c.geom).STIntersects(b.geom)=0

One of those paths goes through the building, which isn’t any help in getting around it. So by added a where clause so that .STIntersects is false, we only see the lines that don’t collide with the building.

MSTU Valid Paths

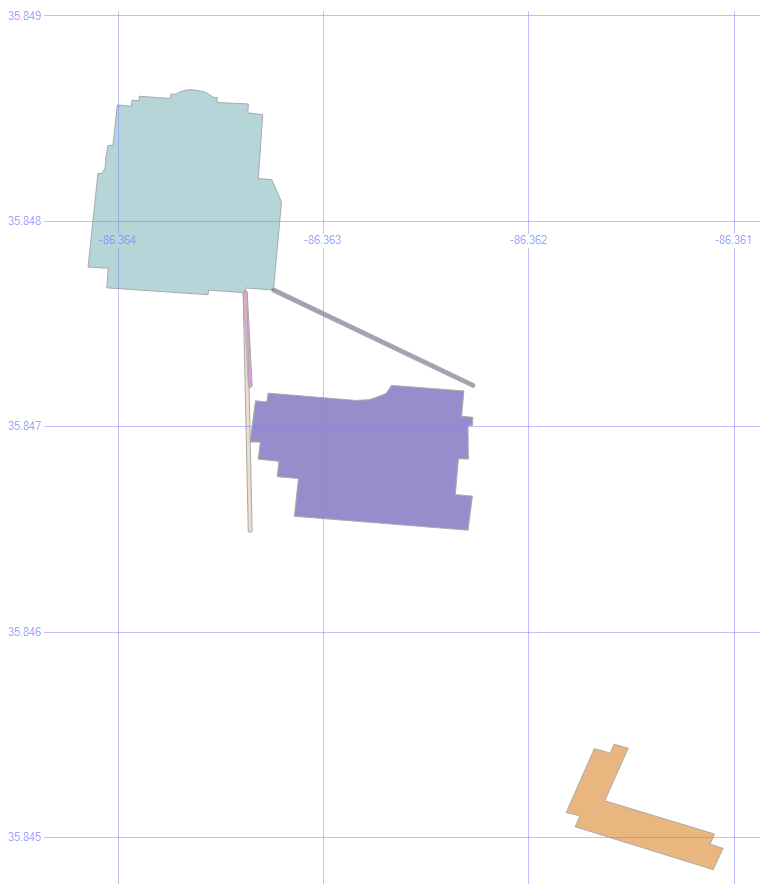
Cool! We’re halfway there.

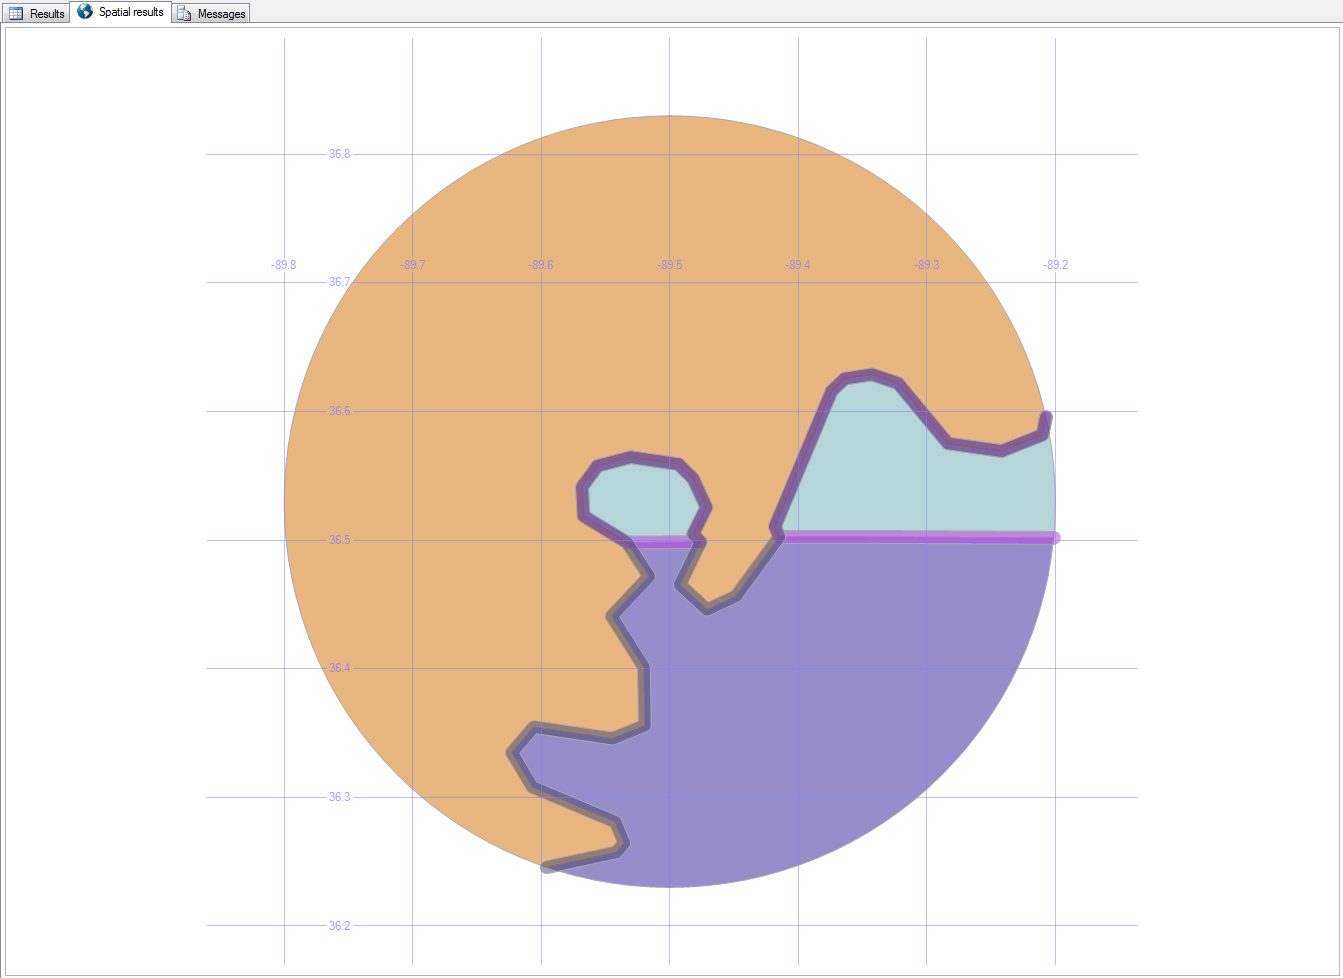
7. Add the Destination

select geom from #orig union all select geom from #dest union all select geom from #bloc union all
select o.geom.ShortestLineTo(c.geom).STUnion(c.geom.ShortestLineTo(d.geom)).STBuffer(.00001)
from #orig o left outer join #corn c on 1=1 left outer join #bloc b on 1=1 left outer join #dest d on 1=1
where o.geom.ShortestLineTo(c.geom).STIntersects(b.geom)=0
and c.geom.ShortestLineTo(d.geom).STIntersects(b.geom)=0

Since those three valid paths are also just geometric data objects, we can use them as the new “origin” for the next leg of our journey.

So, by finding the shortest lines from those lines to the destination building, joining the two line segments into a single object with the .STUnion method, we get:

Full Paths

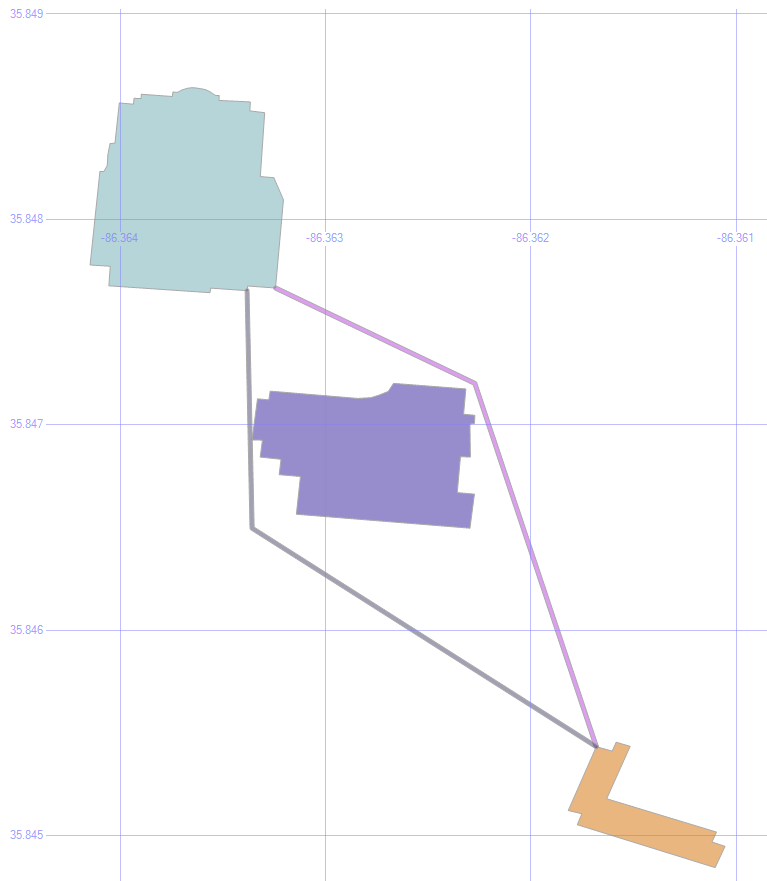
If we were to apply the .STDistance() method to those paths, we’d see that the purplish path is 4.732 meters, and the blueish path is 5.055 meters.

Shortest Path

Typically, of course, the shortest path problem is focused on roads, not taking shortcuts through the grass.

That’s already been solved in a variety of ways. The most common approach is Dijkstra’s Algorithm.

Here are a couple of SQL implementations: one from Peter Larsson, and one from Hans Olav.

The key to making it quick is generally to pre-calculate all the distances. To a point. Computers these days can’t store the distance from every point on Earth to every other point on Earth, any more than every possible chess move on every board.


Spatial Data, Part 2: Local Data

This is part two in a series:

Besides just looking around at states, roads, rivers, and other large-scale features, we have the ability to bring in the structures that we all know and love because they’re right there with us.

Local Data

1. Buildings

Here are the buildings on MSTU Murfreesboro’s campus (which is where I first gave this presentation).

select id, geom, name, [type]
from mstubuildings

This brings back all the buildings on campus.

MSTU Campus

By picking Name as the label, and zooming in enough to where the text is readable, we get this:

MSTU Building Names

2. Building Types

select geometry::CollectionAggregate(geom), [type]
from mstubuildings
group by type

We can group the buildings so that they’re color-coded by type. There are lots of university buildings as expected, and a few other types.

Wait, what’s that brownish building in the bottom right? Condemned? Well, I never!

MSTU Building Types

Don’t worry — the campus isn’t in any danger. It’s just the old dorm.

3. How Many Roads Must a Man Walk Down?

select id, geom, name, [type]
from msturoads

Besides the buildings, we can display the roads.

MSTU Roads

4. Road Types

select geometry::CollectionAggregate(geom), [type]
from msturoads
group by type

There are a lot of “roads” on the map above, but not all of them are what we’d often consider to be a road. So let’s group them by type and see what they are.

MSTU Road Types

The labels come back really tiny, but the blueish top left is pedestrian, the blueish top center is footway, the purplish on the right is service, the pinkish is residential, with primary on the bottom center, and secondary in the bottom right.

5. Road Sizes

if object_id('tempdb.dbo.#roads', 'u') is not null drop table #roads
create table #roads (typ varchar(20), siz float)
insert #roads select 'primary',    .00004
insert #roads select 'secondary',  .00002
insert #roads select 'tertiary',   .00001
insert #roads select 'residential',.000005
insert #roads select 'service',    .0000005
insert #roads select 'footway',    .0000001
insert #roads select 'pedestrian', .0000001
insert #roads select 'steps',      .00000001
select geometry::CollectionAggregate(geom).STBuffer(siz), [type]
from msturoads
inner join #roads on type = typ
group by [type], siz

Let’s change the size of the roads to match a little more closely with what we’d expect.

My unscientific guess is that primary > secondary > tertiary > residential > service > footway > pedestrian > steps. So the temp table above will apply those sizes to the roads via STBuffer, and aggregating them will make them a single color.

MSTU Road Sizes

It looks more like a human-readable roadmap, anyway.

6. Aggregated Buildings and Roads

select geometry::CollectionAggregate(geom), name, ''
from mstubuildings
group by name
union all
select geometry::CollectionAggregate(geom).STBuffer(siz), '', [type]
from msturoads
inner join #roads on type = typ
group by [type], siz

Now, let’s put the buildings and (sized) roads together, and choose Name as the label for the buildings.

MSTU Buildings and Roads

7. Cleaning Up

if object_id('tempdb.dbo.#camp','u') is not null drop table #camp
create table #camp (geom geometry)
insert into #camp (geom)
select geometry::STPolyFromText('POLYGON ((-86.371 35.855, -86.36 35.853, -86.355 35.848, -86.357 35.843, -86.373 35.845, -86.371 35.855))', 0)
select geometry::CollectionAggregate(geom), name, ''
from mstubuildings
group by name
union all
select geometry::CollectionAggregate(geom).STBuffer(siz), '', [type]
from msturoads
inner join #roads on type = typ and siz >= .0000005
group by [type], siz
union all
select geom.STBoundary().STBuffer(.0002), null, null
from #camp

But remember, we’re not just painting a picture — this is queryable data.

So dropping the not-really-roads (footway, pedestrian, steps), and drawing a homemade polygon around the campus, we’re getting closer to a more usable map.

MSTU Boundary

8. Trim the Map

select 0, geometry::CollectionAggregate(geom).STIntersection((select geom from #camp)).STBoundary().STBuffer(.00002), '', ''
from mstubuildings
union all
select id, geom, name, [type]
from mstubuildings
where id = 22
union all
select 0, geometry::CollectionAggregate(geom).STIntersection((select geom from #camp)).STBuffer(siz), '', [type]
from msturoads
inner join #roads on type = typ
group by [type], siz

That polygon doesn’t have to be just for show — we can use it as a filter to only show the geometry that is within it, which “chops away” the parts of the map that we don’t care about.

To highlight a particular building (the Business and Aerospace Building which hosted SQL Saturday 480), just change the buildins into outlines via STBoundary, and union in that one building as-is.

MSTU Cropped with Building Highlight

9. Pick Three Buildings

select id, geom, name, [type]
from mstubuildings
where id in (22, 38, 40)
union all
select 0, geometry::CollectionAggregate(geom).STIntersection((select geom from #camp)).STBoundary(), '', ''
from mstubuildings

Okay, now let’s pick just a couple of buildings to focus on. The BAB, the condemned building, and that building in between.

MSTU Building Focus

10. Save the Buildings for Later

if object_id('tempdb.dbo.#orig','u') is not null drop table #orig create table #orig (geom geometry)
if object_id('tempdb.dbo.#dest','u') is not null drop table #dest create table #dest (geom geometry)
if object_id('tempdb.dbo.#bloc','u') is not null drop table #bloc create table #bloc (geom geometry)
insert into #orig select geom from mstubuildings where id = 22
insert into #dest select geom from mstubuildings where id = 38
insert into #bloc select geom from mstubuildings where id = 40

select geom from #orig union all select geom from #dest union all select geom from #bloc

Let’s save those three buildings for later, and select just them.

MSTU Buildings


In the next post, we’ll use these buildings as we look at ways to get from place to place.

Downloads

Here’s the Excel file with the scripts to create and load the road and building tables.


Spatial Data, Part 1: Introduction

One of my favorite things about SQL is spatial data.

By using the datatypes geography and geometry, we can learn things about the facts and figures that we’re looking though that we might not have noticed without mapping.

Here are some of the basics of how to look at spatial data. Once we’ve gone through these building blocks, we’ll look at some of the things we can do with it.

This is part one in a series:

Introduction

Now, let’s kick the tires and see what spatial data is about.

1. Geospatial Data

select state, geom, geom.ToString() geomtext from us_stateshapes

This command selects the field called geom, which is of data type geometry. It also selects the geom field in string format.

Geom Text

The string results are shown as polygons and multipolygons.

Next to the Results tab is a Spatial Results tab.

States

Right there in SQL Server Management Studio (SSMS), we see a picture of the US!

Clicking the Label Column adds the state abbreviation to the map as well, and the Grid Lines checkbox toggles whether or not the latitude and longitude lines are visible.

State Labels

2. Where Clause

select state, geom from us_stateshapes where state not in (‘AK’,‘HI’)

Since this is just a T-SQL statement, you can exclude some states or show only specific ones.

Continental

select state, geom from us_stateshapes where state = 'KY'

KY

3. Combine Shapes

select geometry::UnionAggregate(geom) from us_stateshapes where state not in ('AK','HI')

All of the states can be combined into a single shape by using the UnionAggregate function.

Country

Now it doesn’t quite look like a rainbow vomited onto the map.

4. Combine Shapes with Outlines

select geometry::CollectionAggregate(geom) from us_stateshapes where state not in ('AK','HI')

The outlines of each state can be retained by using the CollectionAggregate instead.

State Lines

5. Highlight a State

select geometry::UnionAggregate(geom)
from us_stateshapes
where state not in ('AK','HI','KY')
union all
select geom from us_stateshapes where state = 'KY'

By filtering out a state and aggregating the rest of the country into a single color, then unioning that missing state back in, we can essentially change that state’s color.

KY Highlighted

6. County Detail

select geometry::CollectionAggregate(geom)
from ky_counties

“Zooming in” a bit, and reading from the counties table, we can see all the counties in Kentucky.

KY Counties

It’s just as easy to highlight a county, with or without the other counties being outlined.

select geom
from us_stateshapes
where state = 'KY'
union all
select geom
from ky_counties
where id = 24

KY with Jefferson County

9. Life is a Highway

select s.geom from us_stateshapes s where s.state = 'KY'
union all
select geometry::CollectionAggregate(i.geom) from us_stateshapes s
left outer join ky_interstates i on 1=1
where s.state = 'KY' and i.geom.STIntersects(s.geom) = 1

Need to find your way around? Add the interstates to the map.

KY Interstates

8. Zip Codes

select geom
from ky_counties
where id = 24
union all
select geometry::CollectionAggregate(geom)
from ky_zip

Zooming in a bit more, here are the zip codes within Jefferson County.

Jefferson County Zip Codes

They’re a lot more… disjointed than I expected them to be.

9. Bubbleland

select geom.STIntersection(geometry::Point(-89.5,36.53,0).STBuffer(.3))
from us_stateshapes
where state in ('ky','tn','mo') 
union all 
select geom.STBoundary().STIntersection(geometry::Point(-89.5,36.53,0).STBuffer(.3)).STBuffer(.005)
from us_stateshapes
where state in ('ky','mo')

Here’s a strange place in Kentucky…

Bubbleland, as it’s been nicknamed, is a place in Kentucky that can only be accessed (by land) from Tennessee.

Bubbleland

You can read more about Bubbleland here.

In the next post, we’ll look at local roads and buildings.

Downloads

Here’s the Excel file with the scripts to create and load the road and building tables.

Special Characters in SQL Server

Databases sometimes get unexpected characters in their data.

If your customer’s name is “José” but you search for “Jose”, you won’t (by default) find him.

Here’s a simple way to take care of that in your SQL database, without changing the data that you have.

select 'áàâãäåāăąćĉċčďđéëêèēĕėęĝğġģĥħìíîïĩīĭįıĵķĺļľłñńņňòóôõöōŏőơŕŗřśŝşšţťŧùúûüũūŭůűųưŵŷźżž'
select 'áàâãäåāăąćĉċčďđéëêèēĕėęĝğġģĥħìíîïĩīĭįıĵķĺļľłñńņňòóôõöōŏőơŕŗřśŝşšţťŧùúûüũūŭůűųưŵŷźżž' Collate SQL_Latin1_General_CP1253_CI_AI
select 'ĥéĺłô ŵòŕľđ' Collate SQL_Latin1_General_CP1253_CI_AI

Using Collate SQL_Latin1_General_CP1253_CI_AI, you can leave all the accents in your data, but still treat it like it’s all made up of “normal” characters.

It’s also great as you’re transferring data from one system to another, if the second system can’t handle those characters because of technology or programming limitations.

Life in the Clouds

Here is my year, presented in word cloud format from my three feeds.

There’s a lot of overlap, as you’d expect, but each platform presents its own slice of my life.

Blog

Blog Wordle 2015

Twitter

Twitter Wordle 2015

Facebook

Facebook Wordle 2015

Master Data

Master Data Management (MDM) is a way of keeping your data accurate.

I’ve spoken about MDM at companies, technology groups, business groups, database groups, conferences, college classes, and more.

Here’s the general overview that I typically give (download the PowerPoint file).

Overview

“Too much information is driving me insane.” (Too Much Information, The Police, 1981)

“Two men say they’re Jesus. One of them must be wrong.” (Industrial Disease, Dire Straits, 1982)

“A man with one watch always knows what time it is. A man with two watches is never sure.” (San Diego Union, Lee Segall, 9/30/1930)

To master your data, take these steps:

  • look at each record of incoming data
  • standardize the formatting (phone numbers, addresses, etc.)
  • validate that it is allowable in your system (sure, 1/1/1900 is a real birthdate, but is it really the date that you made a sale?)
  • have a human being look through the edge cases (this John Smith might be the same as that other John Smith)
  • integrate the good/new/updated record into your master
  • communicate the update/entry to any systems that are interested

Benefits

When this is done, it opens up many possibilities for improvement.

When you know that your data is correct, you can:

  • govern it (lock down who can add/change data, and make it adhere to your own rules)
  • synchronize it (keep all your systems in tune with each other)
  • centralize it (set up a single master ID that keeps pointers to other systems and IDs)
  • log it (see how and when data changed, and which system and person did it)
  • analyze it (for meaningful results)
  • mine it (for unexpected insights)
  • act on it (make faster and better decisions)
  • enrich it (roll in data from outside sources like the Better Business Bureau, US Census Bureau, and others)
  • adapt it (if you acquire a new company, merging their data with your becomes much more manageable)
  • scale it (if you need to process 100x more information, it becomes a matter of adding new hardware as needed)

Horizon

Once it’s all running smoothly, you could also:

  • improve retention by finding existing customers who feel ignored
  • prevent fraud by comparing new data with old, according to patterns that you expect
  • minimize returned mail and packages by ensuring that addresses are accurate
  • identify your best customers (least effort, most profit = cash cows) and keep them happier
  • find mismatched data (do John Sr, John Jr, and John III all live at the same address? separate them)
  • absorb new sources and new types of data easily
  • stop wasting time with yoyos (customers who come and go and come and go)
  • find the key influencers in your network of customers and leads
  • grab the low-hanging fruit (least effort, big payoff)

Download the slides here

Post Mortem

Sometimes called a retrospective or autopsy, a post mortem is a means of looking back at an event or period of time, to determine what can be learned from it with an eye towards improving what doesn’t work, and keeping what does.

So, here’s how 2015 looked for me and my family — body, heart, mind, and soul.

Body / Personal / Family

There was a lot of loss this year. I lost my job, our home was robbed (twice!), we lost five(!) cars. Thanks to the robberies, our home insurance company ended their coverage, even though they didn’t pay us anything for either robbery, and we bought and installed a hidden camera motion-detecting system after the second robbery (which was a week after the first).  We ended up finding insurance through Liberty Mutual at an even better rate than we were getting.

To make the thefts even more annoying, they took nearly all of our medications, which we had just refilled three-month supplies of. And since my health care coverage had just ended (thanks to losing my job), the day that we lost all those medicines, we had to pay for a month of COBRA just to be able to get those medicines refilled.

Linda nearly died in an emergency room visit when they injected her with a substance that she was allergic to. So instead of a five-hour visit, it turned into a five-day stay in ICU and recovery. We checked with an attorney who said we didn’t have enough proof of wrongdoing/incompetence to do anything.

I had a “UEO”, an unidentified encephalic occurrence. Basically, a stroke that wasn’t a stroke. My brain got all weird and slow, my limbs went numb and tingly, and my speech became less intelligible. The U part of UEO means that the neurologist couldn’t find the cause, and by the time (seven weeks later) that I saw him, the symptoms were all gone.

Heart / Emotional / Arts

Boy, there were plenty of funerals this year. My aunt Dale passed away, and we helped her family with the estate. My friends Steve Goldberg, Ryan Kemp, Elizabeth Burnley, Debi Magnes, and Darren Routt passed away. Plus a few celebrities I looked up to, like Roddy Piper and Mick Lynch.

I attended the Sing-Off at the Louisville Palace, the Nutcracker Suite at KY Center for the Arts (with my niece dancing on stage!), the Real Inspector Hound (a play-within-a-play), Superman: the Musical, the Connect|Disconnect art exhibit, Wait Wait Don’t Tell Me, The Tick!, Project KempProv, the Theater Alliance of Louisville meeting, Market of Mischief with Louis-Villainz.

I cut back on the sci-fi / comic / literary shows that I attend, but this year I still went to ConGlomeration, Mo*Con, WonderFest, Origins Game Fair, GenCon, Imaginarium, and the Louisville Comic Con.

Mind / Technical / Career

I started a new job at Baptist Health. There were several irons in the fire, and it was wonderful to be able to choose among some good offers (tech exec at a startup, budding data scientist at a large insurance company, or data master at a chain of hospitals). Baptist is a great company to work for. I get to do cool stuff with great people, and learn a lot as I go.

I launched TechFest Louisville! That’s a post for another time.

I spoke at a lot of conferences. I spoke at CodepaLOUsa, the Louisville Agile Forum, SQL Saturdays in Nashville, Chattanooga, Atlanta, Columbus, Indianapolis, and Louisville, and Dress for Success.

I was there for many other big events, like VEX Worlds (the worldwide championship of robotic competitions) and the opening of Chattanooga’s TechTown (an amazing makerspace/creative studio for kids).

I attended gobs of other events, like half a dozen Open Coffees, two Startup Weekends, Gear-UpS#*! I Wish I Knew, the Tech Security Conference, two Non-Profit Toolbox conferences, the SBIR/STTR Road Show, the IoT Developer’s Workshop, the How-To Festival, MapTime, the CIO Symposium, the JDRF Diabetes Summit, GeoEd 15, XlerateHealth Demo Day, Mini-Maker Faire, DerbyCon, World Trade Day, TALK‘s tour of the BioAssemblyBot, the Vogt Awards, the Civic Data Alliance party, the Louisville Digital Association party, and TALK’s panel on EMV and retail tech.

Soul / Spiritual

I taught several classes at Southeast Christian, I preached at Bible Abridged: the Complete Word of God in 90 MinutesConGlomeration, Imaginarium, and the Louisville Comic Con. I helped the Grave Robbers ministry (an outreach to goths and punks) at Ichthus Festival, and met a variety of ministries at the Global Missions Health Conference.

The Year in Photos

Prosthetic Fist-Bump TechTown Farkin' TechFest TechFest Gadgetry TechFest Kickoff TechFest Fun SQL Saturday Atlanta Mini-Me RIP Ryan Kemp Beth Cannon Mike Stackpole Buddy Christ GenCon Church Service GenCon Booth

Events and Comradery

Many organizations have get-togethers in December. It’s a good chance to catch up with friends and colleagues, and find new connections.

If you’re in the Louisville area, here are some of the social gatherings that I’m quite likely to attend.

And here are some more focused events.

And shopping/entertainment opportunities.

You can keep up with all the events I’m part of or interested in on my calendar.


Health Tech

Thursday was the annual XlterateHealth’s Demo Day. The healthcare startups involved all showed off their latest and greatest ideas and achievements. I love checking out the new ideas that inventors and creators come up with.

Here are the companies that were there showing their wares:

Digital

  • iClinical is an app for trial clinicians to collect, analyze, and display realtime test results, saving months of time in the research process. Also, since the data is pulled in as it happens, they can quickly respond to changes. Imagine that during the trial, they find out that someone with a certain condition or taking a certain drug has died. The clinicians could send out an instant alert to others in the same metaphorical boat to have them stop the test and seek help.
  • Trajectory is a data analysis tool that studies lots of patients who have had a similar health occurrence (stroke, heart attack, etc.), and finds similarities before and after. This helps to identify accurate warning signs and the most effect treatment.
  • SYSGenomics uses molecular diagnostic tests to predict which type of cancer treatment is likely to be the most effective for any given cancer patient.
  • MedUX combines a video display and a sterile wireless joystick so that doctors can access medical systems even after they’ve scrubbed up.

Physical

  • Inscope invented a laryngoscope (the tube that doctors use to intuabte your airways) that is wifi enabled with an onboard video feed. That makes it easier and safer for the tubes to go into the right place without scraping or bruising the throat as it goes.
  • NormaLyte created a drink mix that reverses the effect of dehydration. This is also great for relief efforts in areas where water is rare or tainted, by helping people’s bodies get more use out of the water that they do drink.
  • iPillbox is a pill organizer that let doctors and caregivers monitor whether or not their patients have taken their medicines. Imagine that your parents are aging and taking many types of medications at different frequencies throughout the day; this could alert you that they missed their lunchtime pills.

This year, the event was held at the Play Dance Bar, which I hadn’t been to yet. (Me not frequenting dance clubs; go figure.) The place was decorated for Halloween. Very nicely done, too.

Here’s the Business First article about the event.

Thursday was also the “Data! Fostering Health Innovation in Kentucky and Ohio 2015” event, that I didn’t hear about early enough to get involved with. But a friend who went told me that even thought “data” was the first word in the event, it was mostly Department of Health officials talking about policy. Bullet dodged.

Can't Sleep, Clowns Will Eat Me Oh What a Feeling, Monsters on the Ceiling I See Dead People


Robots

The REC Foundation (Robotics Education and Competition Foundation) hosts the VEX Robotics Competition each year. This is a competition for middle schoolers, high schoolers, and collegians. The worldwide championship came to Louisville in 2015, and will stay here for at least four more years. That’s a whole lotta flights, hotels, restaurants, and shuttling — about $5 Million worth.

At this year’s event, I volunteered for all four days of the event (Wednesday through Saturday). I was at the registration table for the first two days, which was an amazing experience. With over 800 teams from around the world, there were volunteers at the desk who could speak Portuguese, Mandarin, and a host of other languages. Each team had several students, plus their coaches, meaning that there were roughly 10,000 participants all told. For the next two days, I manned (i.e. “commandeered”) the booth for FirstBuild. They were one of the event sponsors, but didn’t realize that they’d also be getting a booth out of the deal. Since the booth would have been empty otherwise (which would disappoint me), and since I had a FirstBuild t-shirt, I sat at the booth and told people what FirstBuild is, how it came to be, what they do, and how jealous they should be because they haven’t been there yet.

The event is huge. It takes over the entire Fairgrounds and Expo Center — all four wings, and both stadiums.

You can volunteer here. (You don’t have to commit for the entire event like I did.) You don’t need to know anything about robots — they need all sorts of volunteers: registration, coordination, setup, scoring, etc. Kids can also help out, so this is a great family activity.

This week, the REC met with the Convention and Visitors Bureau, and dozens of leaders from business, technology, government, and education. (And somehow, also me.) They let us know some pretty cool things:
• the State Championship might be happening at U of L
• NASA has given them a grant to get at least one robot into every school in the county
• they’ll be offering “combo” exhibitor space in a Louisville Showcase for local business and tech, to make the sponsorship rates more affordable
• the event will once again coincide with the Thunder Over Louisville celebration
• they’ll once again rent out the entire Kentucky Kingdom amusement park for the kids Saturday night
• there are many scholarships for entry, including one from U of L

Here are some other cool robotic groups around town, if you’d like to find out more or get involved:
• The U of L Robotics Team
• The U of L Engineering Outreach
Advanced Solutions
DUG, the Drone Users Group
• The First Robotics competition

VEX Championship Arenas Rock Star Kids Robots in the Arena Robot Teams Nothin' But NetAww, He's So Cute