One of my favorite things about SQL is spatial data.
By using the datatypes geography and geometry, we can learn things about the facts and figures that we’re looking though that we might not have noticed without mapping.
Here are some of the basics of how to look at spatial data. Once we’ve gone through these building blocks, we’ll look at some of the things we can do with it.
This is part one in a series:
- Part 1, Introduction
- Part 2, Local Data
- Part 3, Getting Around
- Part 4, Data Sets
- Part 5, Resources
Introduction
Now, let’s kick the tires and see what spatial data is about.
1. Geospatial Data
select state, geom, geom.ToString() geomtext from us_stateshapes
This command selects the field called geom, which is of data type geometry. It also selects the geom field in string format.

The string results are shown as polygons and multipolygons.
Next to the Results tab is a Spatial Results tab.
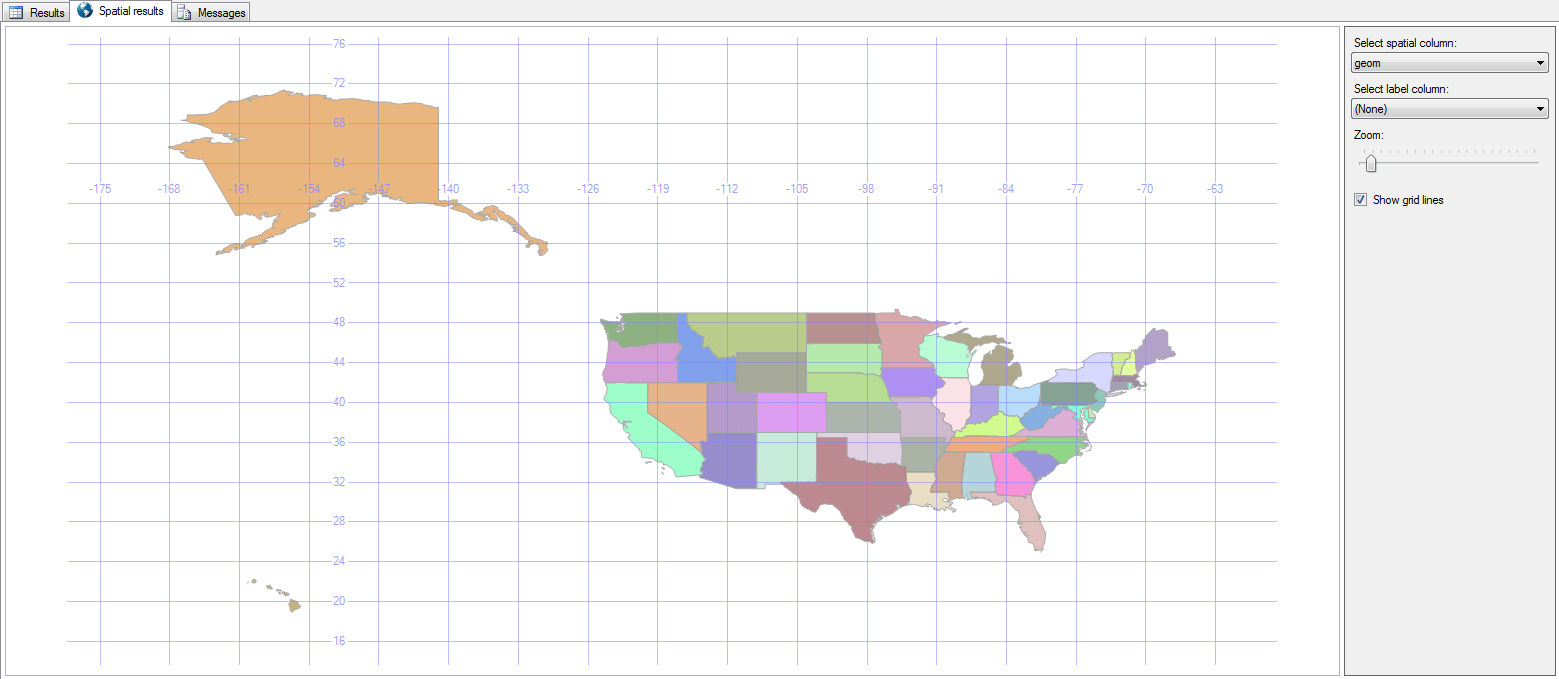
Right there in SQL Server Management Studio (SSMS), we see a picture of the US!
Clicking the Label Column adds the state abbreviation to the map as well, and the Grid Lines checkbox toggles whether or not the latitude and longitude lines are visible.

2. Where Clause
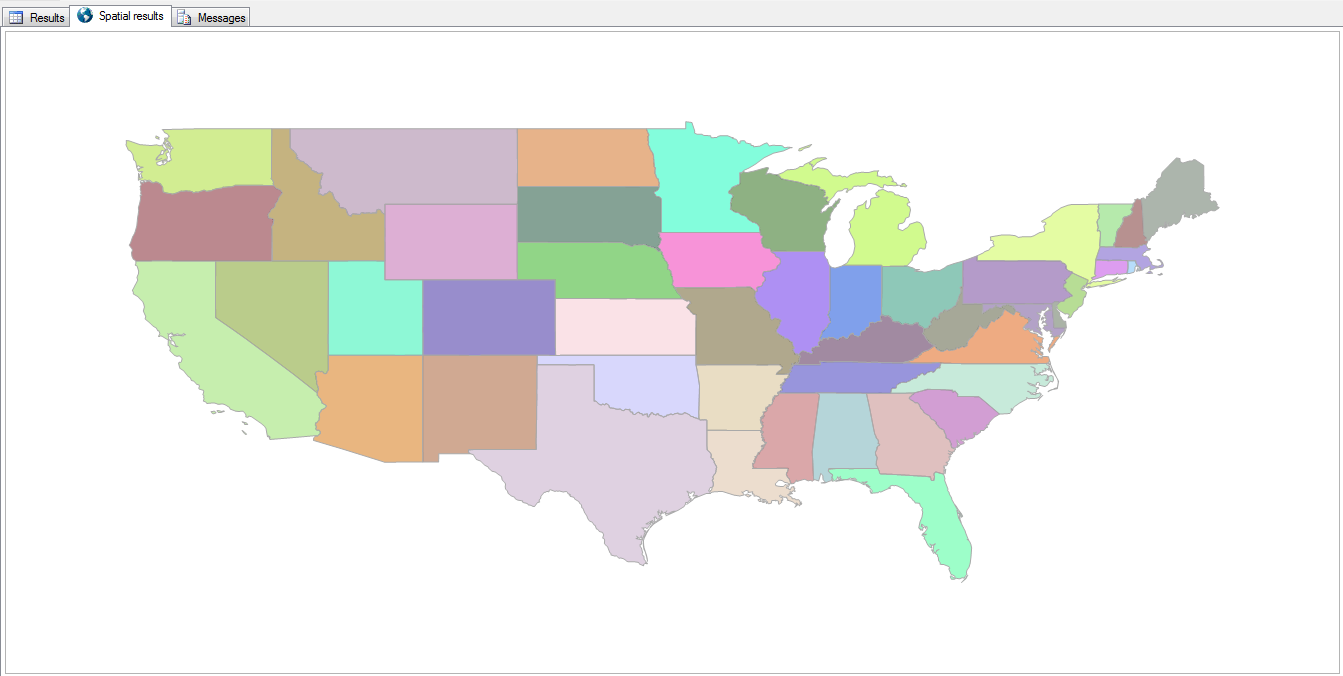
select state, geom from us_stateshapes where state not in (‘AK’,‘HI’)
Since this is just a T-SQL statement, you can exclude some states or show only specific ones.
select state, geom from us_stateshapes where state = 'KY'

3. Combine Shapes
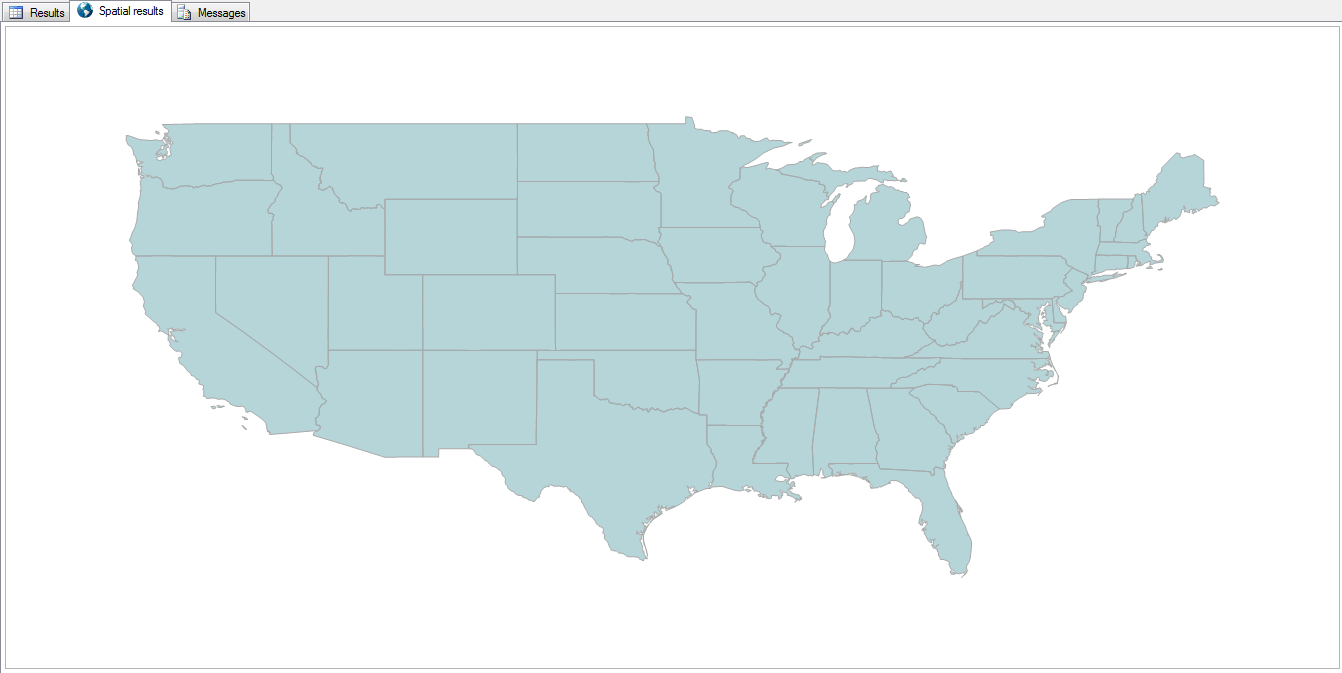
select geometry::UnionAggregate(geom) from us_stateshapes where state not in ('AK','HI')
All of the states can be combined into a single shape by using the UnionAggregate function.

Now it doesn’t quite look like a rainbow vomited onto the map.
4. Combine Shapes with Outlines
select geometry::CollectionAggregate(geom) from us_stateshapes where state not in ('AK','HI')
The outlines of each state can be retained by using the CollectionAggregate instead.
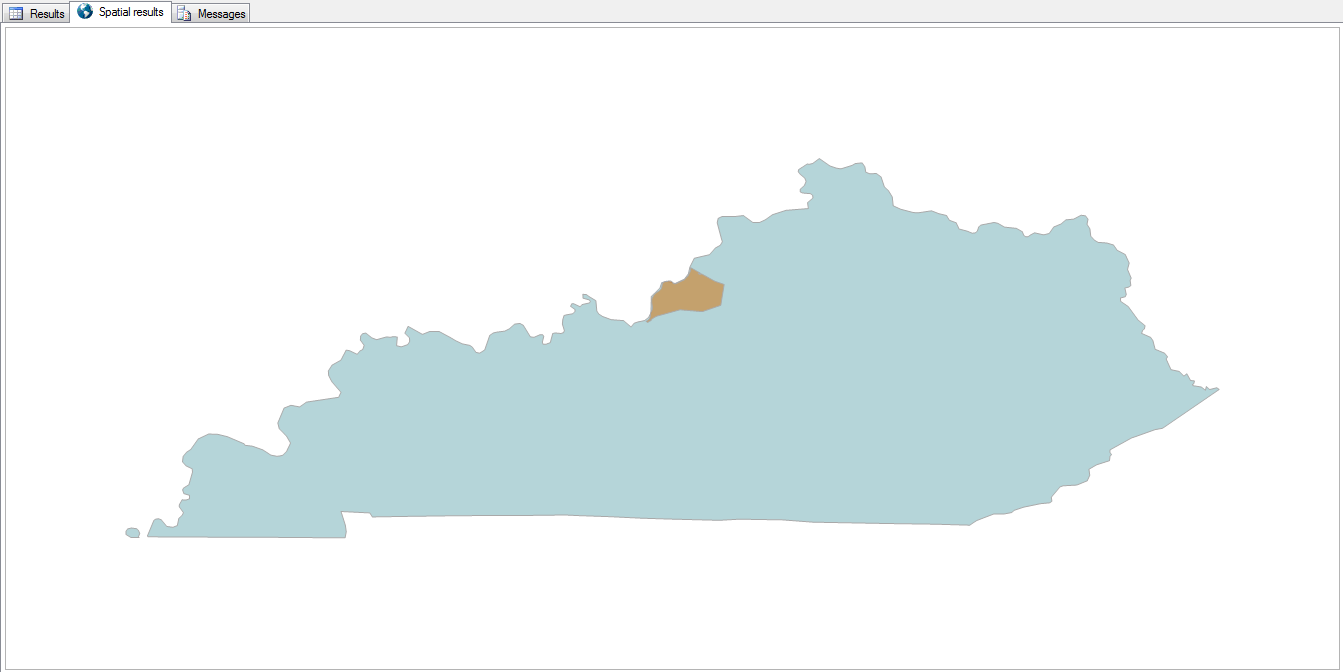
5. Highlight a State
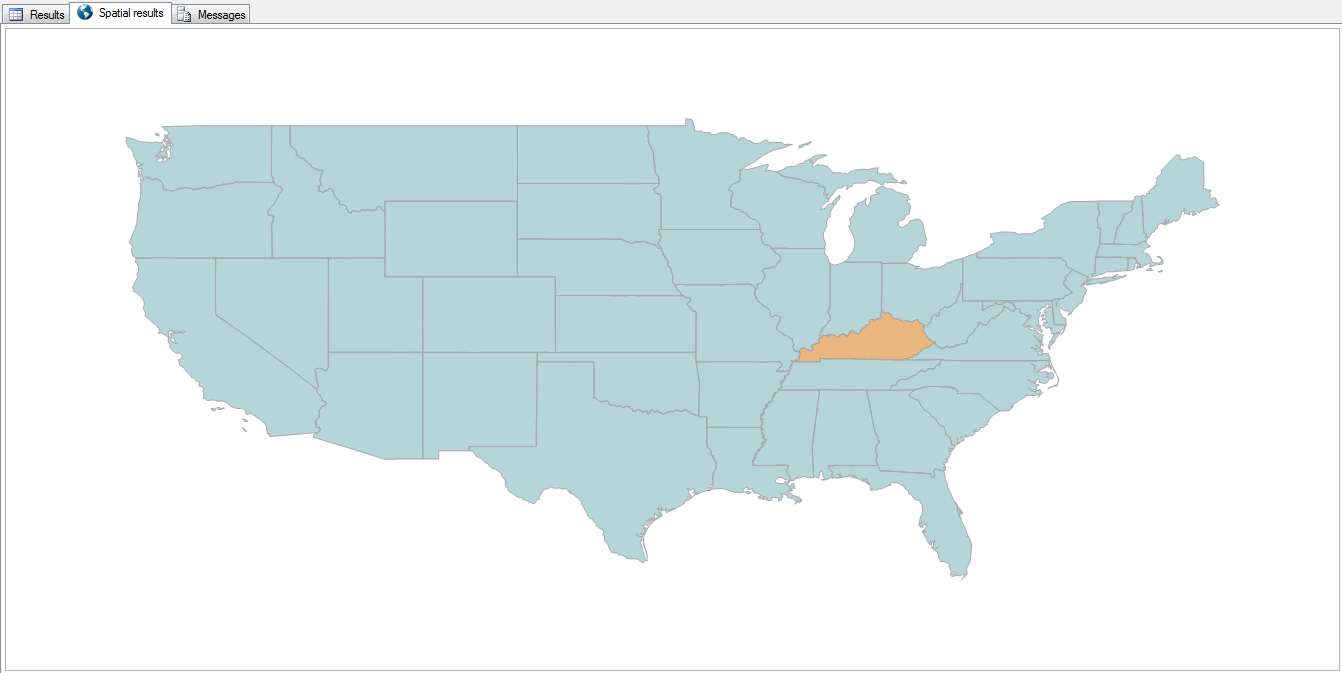
select geometry::UnionAggregate(geom)
from us_stateshapes
where state not in ('AK','HI','KY')
union all
select geom from us_stateshapes where state = 'KY'
By filtering out a state and aggregating the rest of the country into a single color, then unioning that missing state back in, we can essentially change that state’s color.
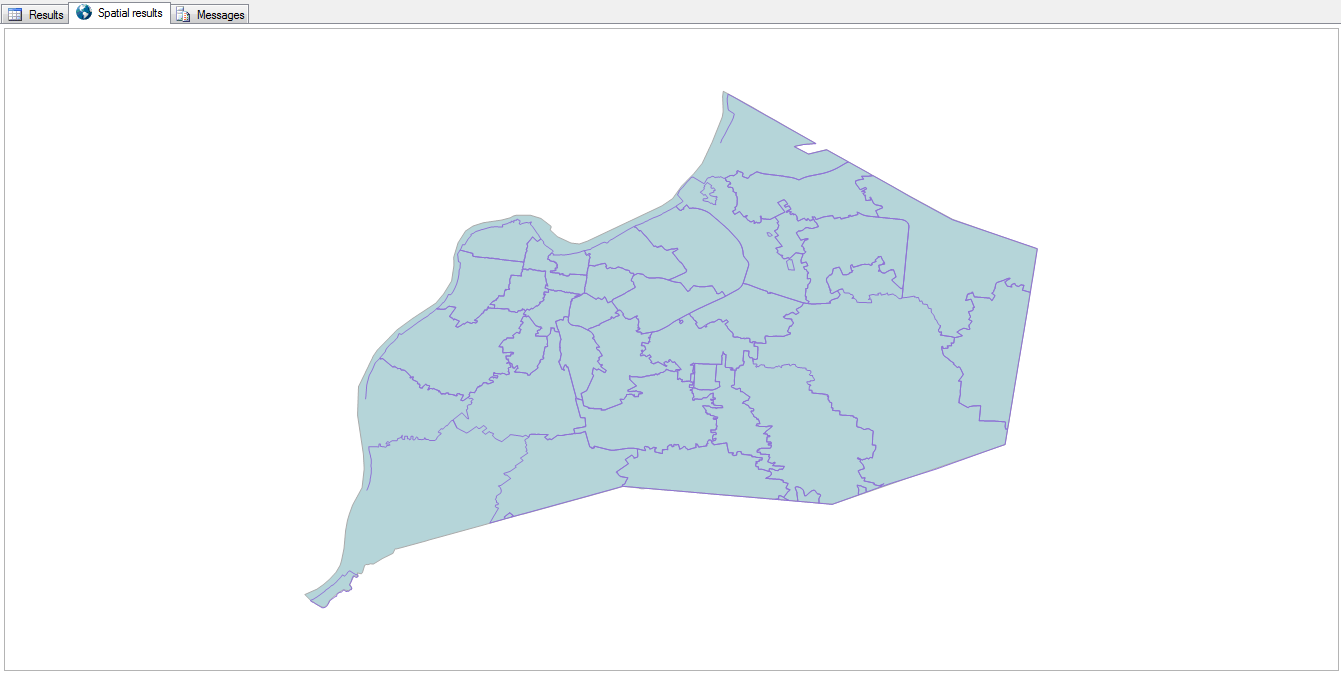
6. County Detail
select geometry::CollectionAggregate(geom)
from ky_counties
“Zooming in” a bit, and reading from the counties table, we can see all the counties in Kentucky.

It’s just as easy to highlight a county, with or without the other counties being outlined.
select geom
from us_stateshapes
where state = 'KY'
union all
select geom
from ky_counties
where id = 24
9. Life is a Highway
select s.geom from us_stateshapes s where s.state = 'KY'
union all
select geometry::CollectionAggregate(i.geom) from us_stateshapes s
left outer join ky_interstates i on 1=1
where s.state = 'KY' and i.geom.STIntersects(s.geom) = 1
Need to find your way around? Add the interstates to the map.

8. Zip Codes
select geom
from ky_counties
where id = 24
union all
select geometry::CollectionAggregate(geom)
from ky_zip
Zooming in a bit more, here are the zip codes within Jefferson County.
They’re a lot more… disjointed than I expected them to be.
9. Bubbleland
select geom.STIntersection(geometry::Point(-89.5,36.53,0).STBuffer(.3))
from us_stateshapes
where state in ('ky','tn','mo')
union all
select geom.STBoundary().STIntersection(geometry::Point(-89.5,36.53,0).STBuffer(.3)).STBuffer(.005)
from us_stateshapes
where state in ('ky','mo')
Here’s a strange place in Kentucky…
Bubbleland, as it’s been nicknamed, is a place in Kentucky that can only be accessed (by land) from Tennessee.
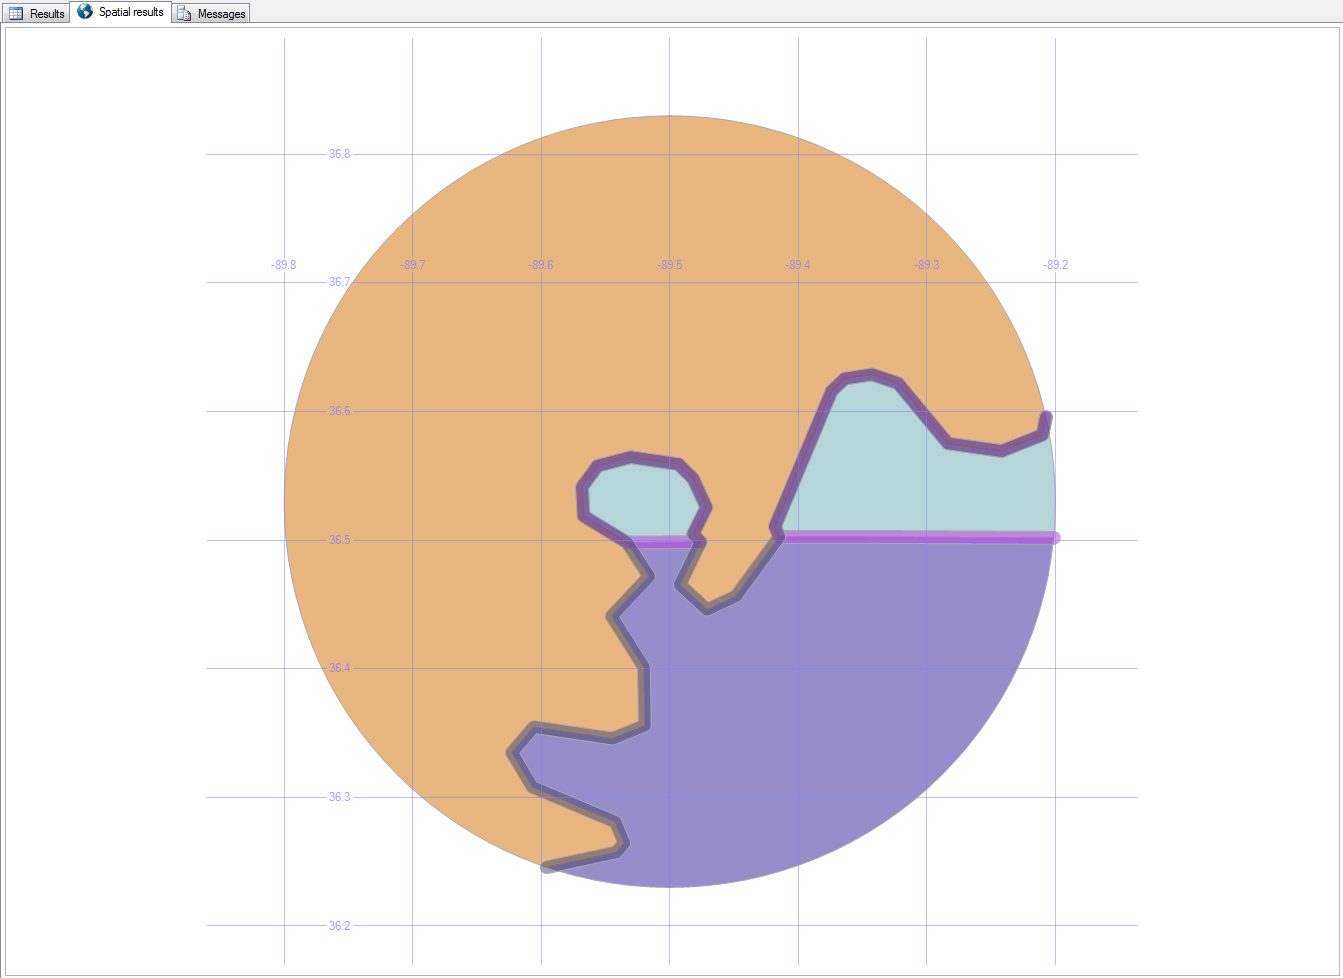
You can read more about Bubbleland here.
In the next post, we’ll look at local roads and buildings.
Downloads
Here’s the Excel file with the scripts to create and load the road and building tables.
