Spatial Data, Part 5: Resources

This is part five in a series:

The things we’ve looked at over the last few lessons come from things that I’ve picked up from the people and places that I mention here.

Resources

1. Smart People

Much of what I’ve learned, I learned from these folks:

2. Recursion and Fractals

Simon Greener shows how to make a circle that’s made of circles, with text showing their position. The whole Spatial DB Advisor is filled with amazing tricks.

Alastair Aitchison shows have to draw recursive triangles.

Slava Murygin shows how to make recursive snowflakes.

Recursive Circles Fractal TriangleSnowflake

3. Artwork

Alex Whittles shows how to convert a vector image into geospatial data.

Click these images to see how to make Grinch, a Christmas tree with proper coloring, one with random ornaments, Venus, or a hotel floorplan.

Grinch Colored Tree Random Tree Venus Floorplan

4. Utilities

SQL Magazine offers a quite of utilities to handle a variety of graphic and charting situations.
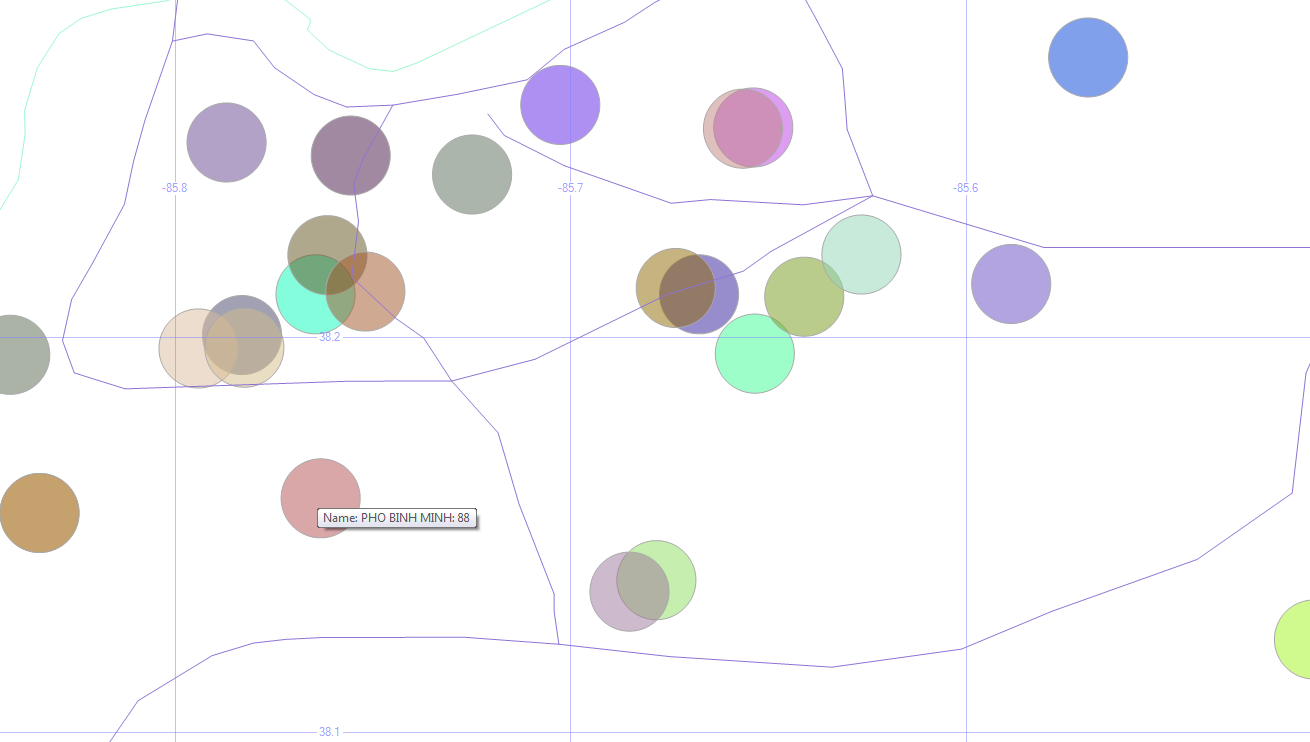
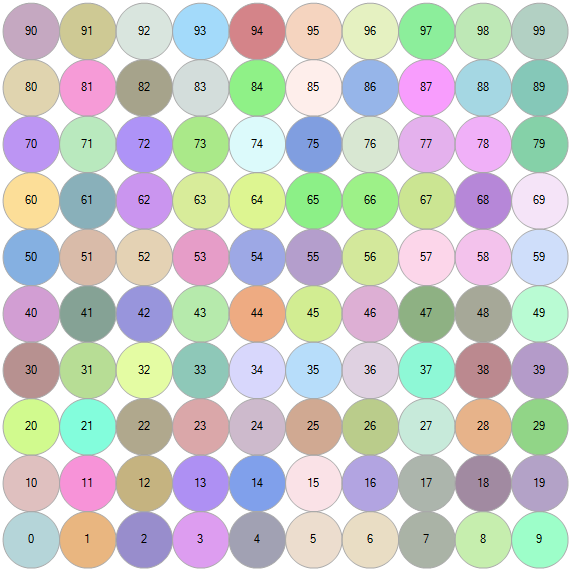
Download here.

5. Color Palette

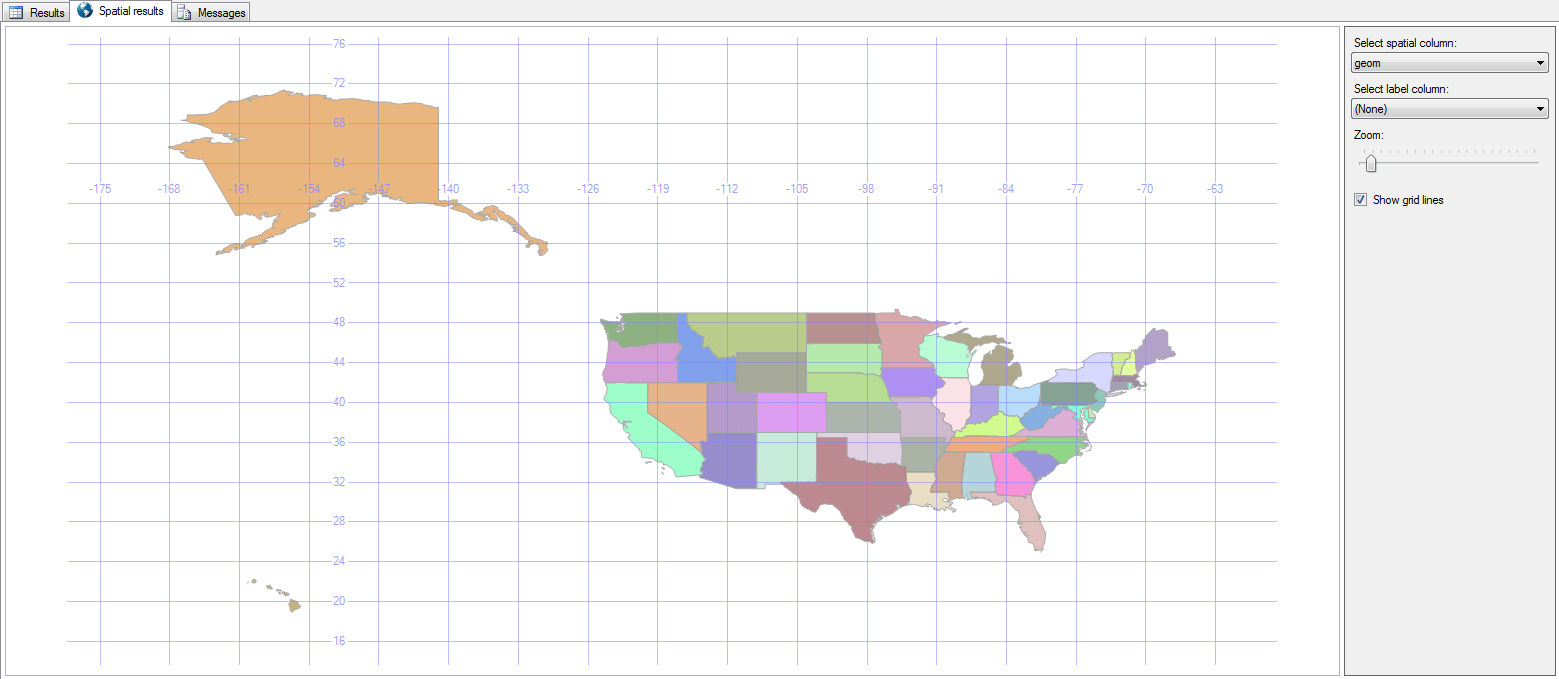
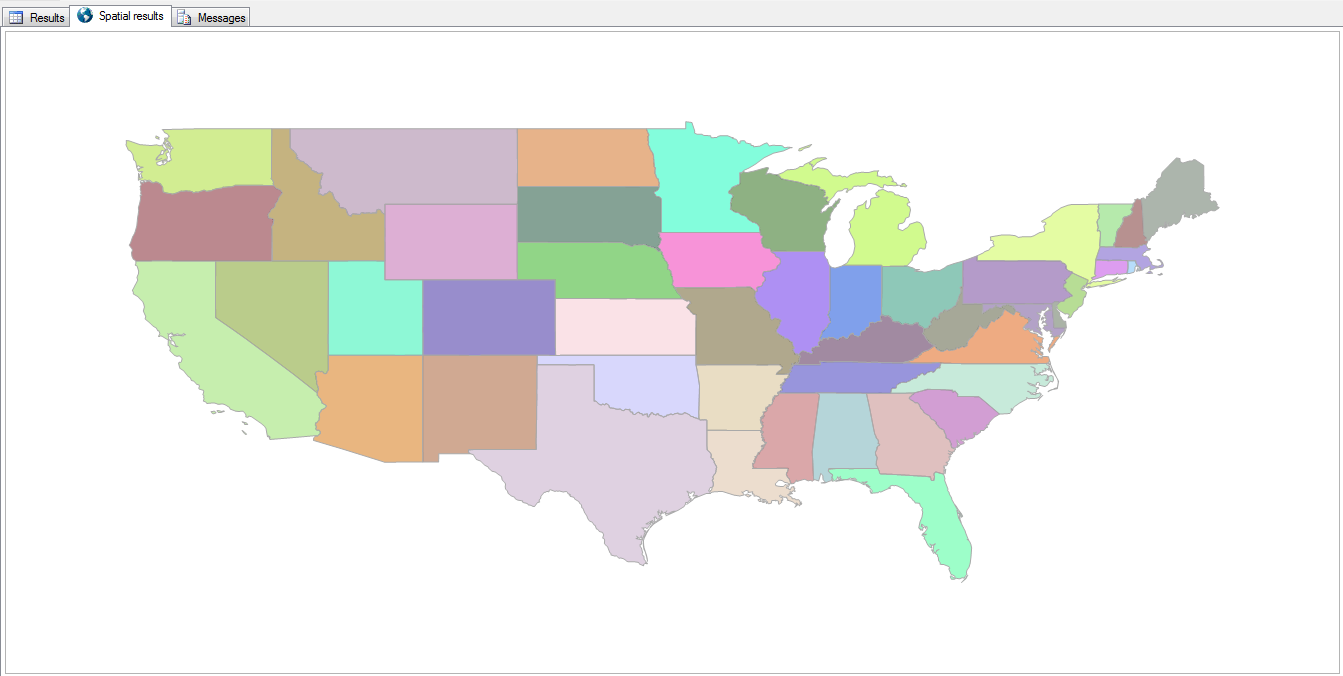
The default color scheme that SQL uses doesn’t always fit the bill. But by specifying the order of the items you display, you can control which one gets which color.

;with n(x) as (select 0 union all select x+1 from n where x < 99)
select cast(x as varchar) label,
geometry::Point(x%10,x/10,0).STBuffer(.5)
from n order by x

The palette ends up looking like this.

Colors

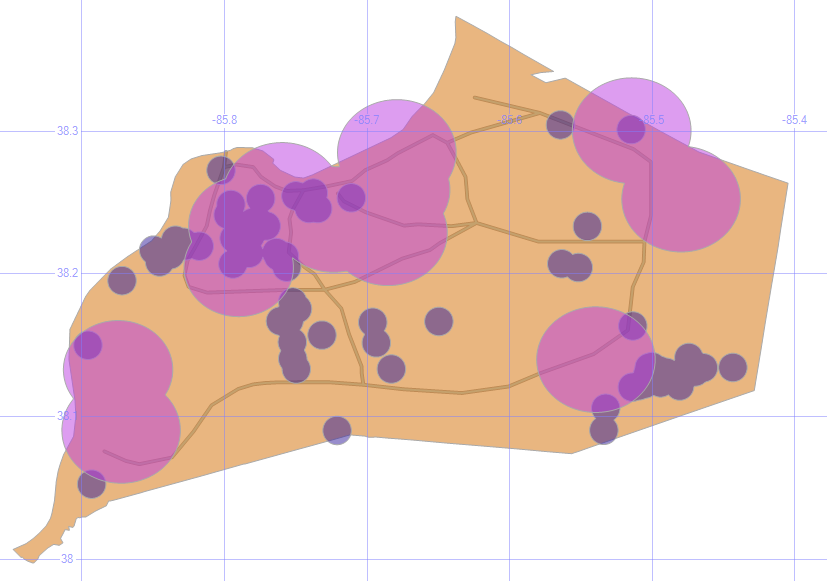
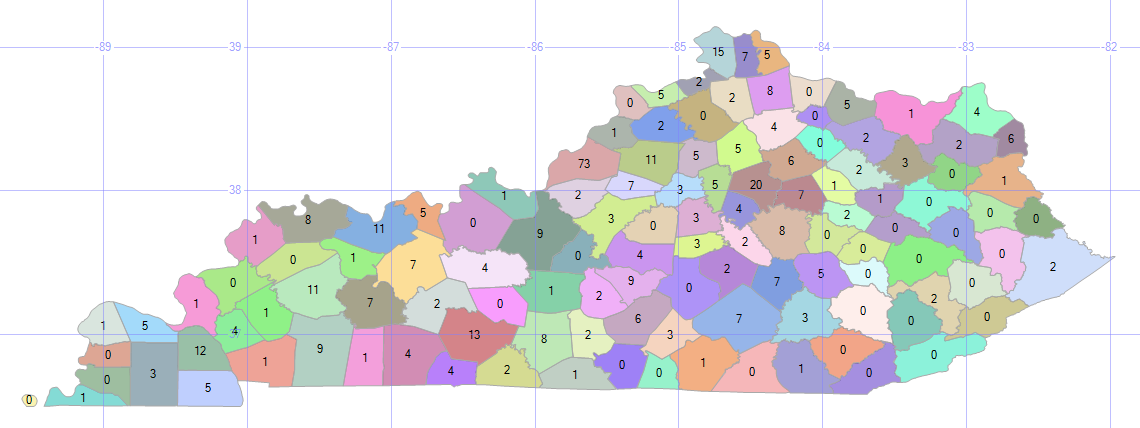
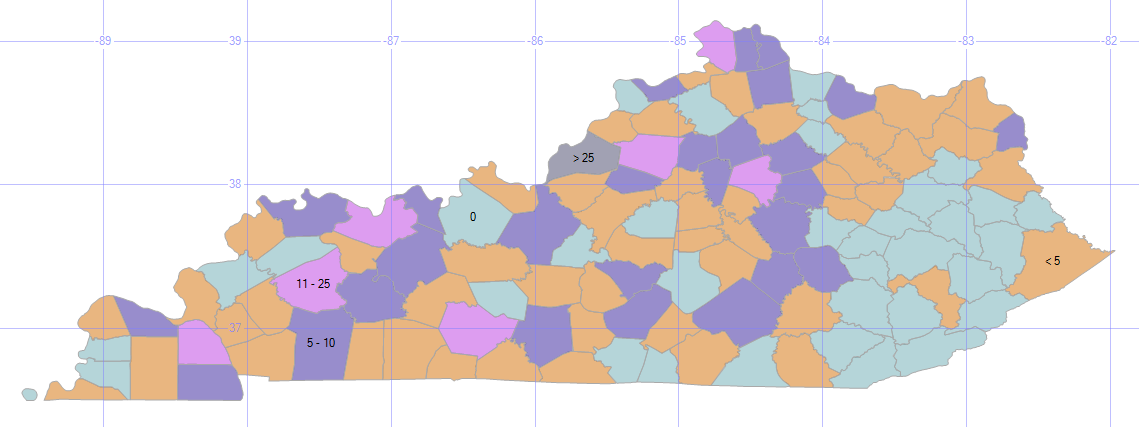
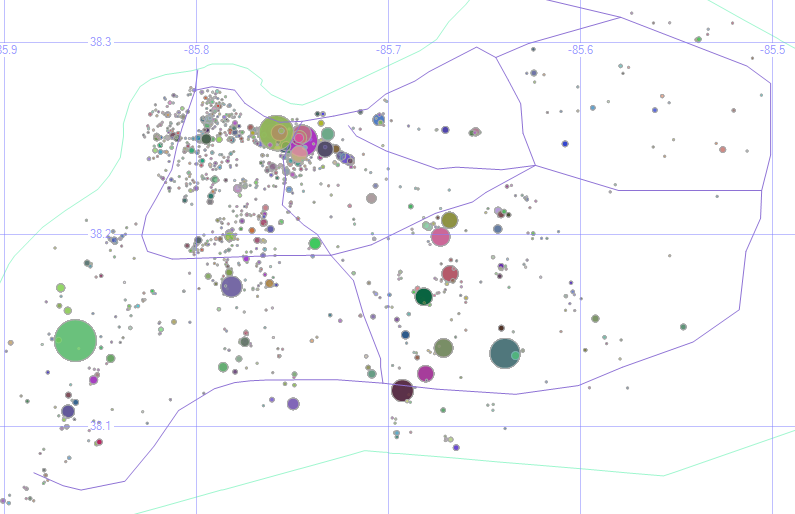
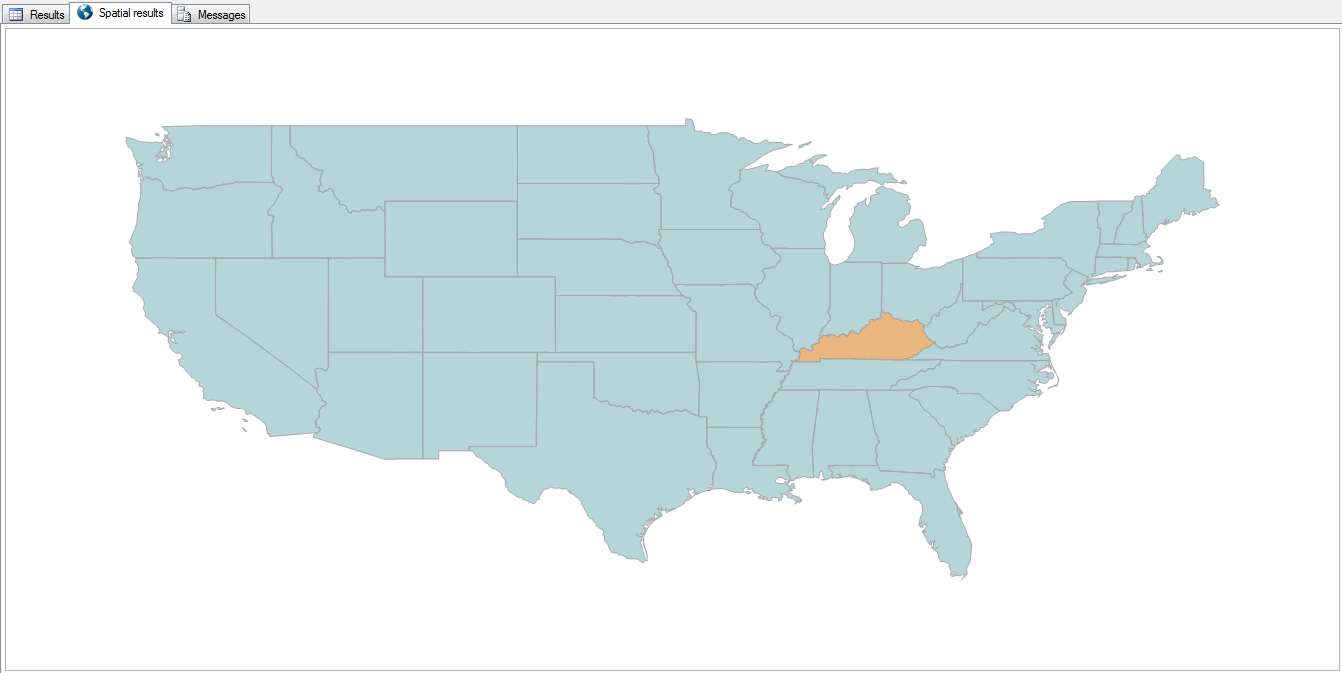
6. Finding Geospatial Data

There are many collections of geospatial data available for free (and many more for pay). Being a cheapskate myself, I tend to stick with free as much as possible.

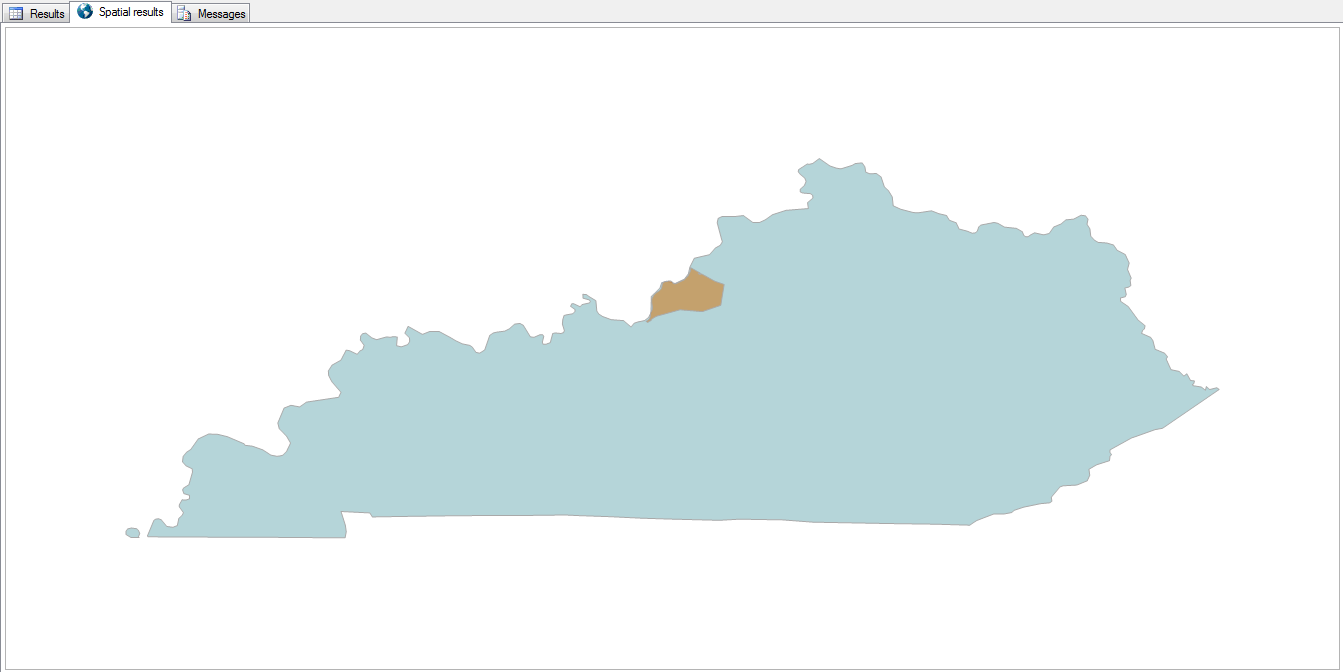
Search for terms like shapefile, geospatial, data, and the region (Kentucky, etc.) and the type of data (geography, roads, elevation, demographics, roads, etc.) that you’re interested in.

I generally prefer to work with .SHP shapefiles, but there are a number of filetypes out there. KML (Keyhole Markup Language) is another popular one.

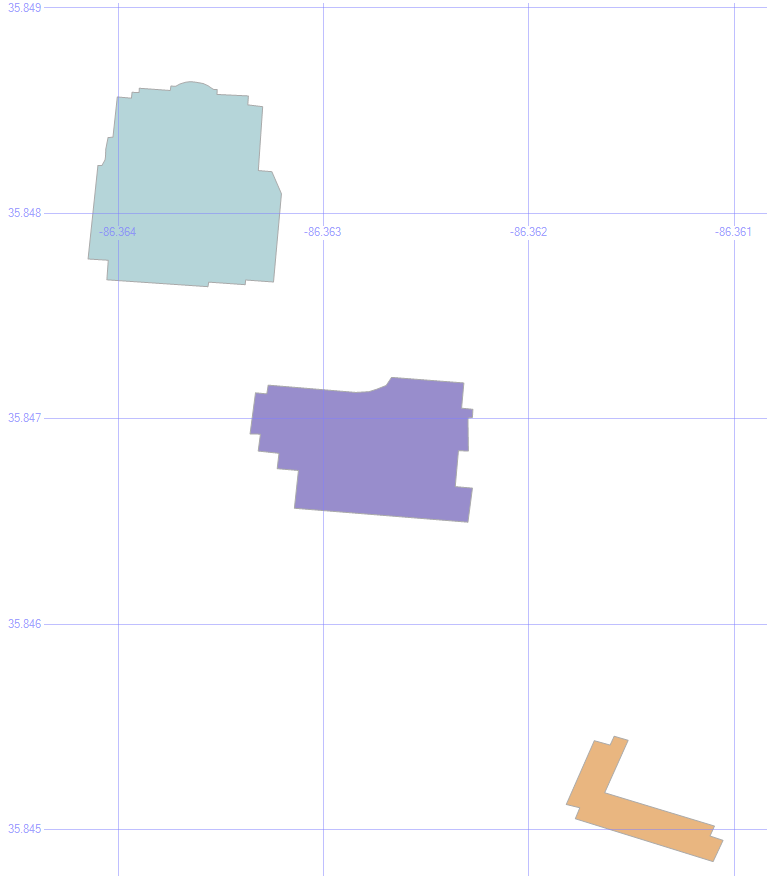
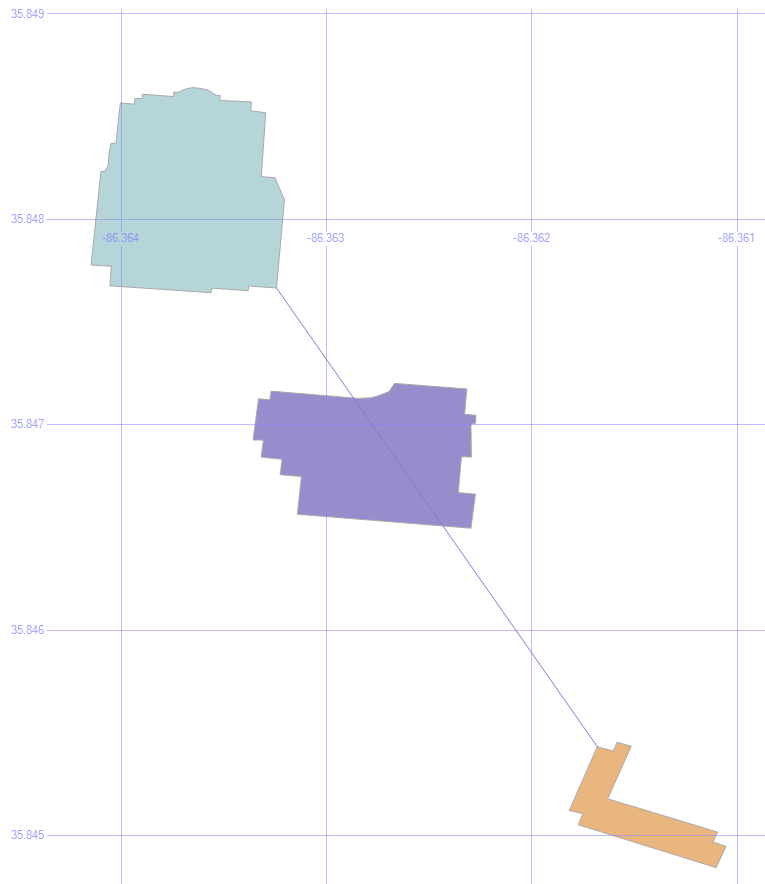
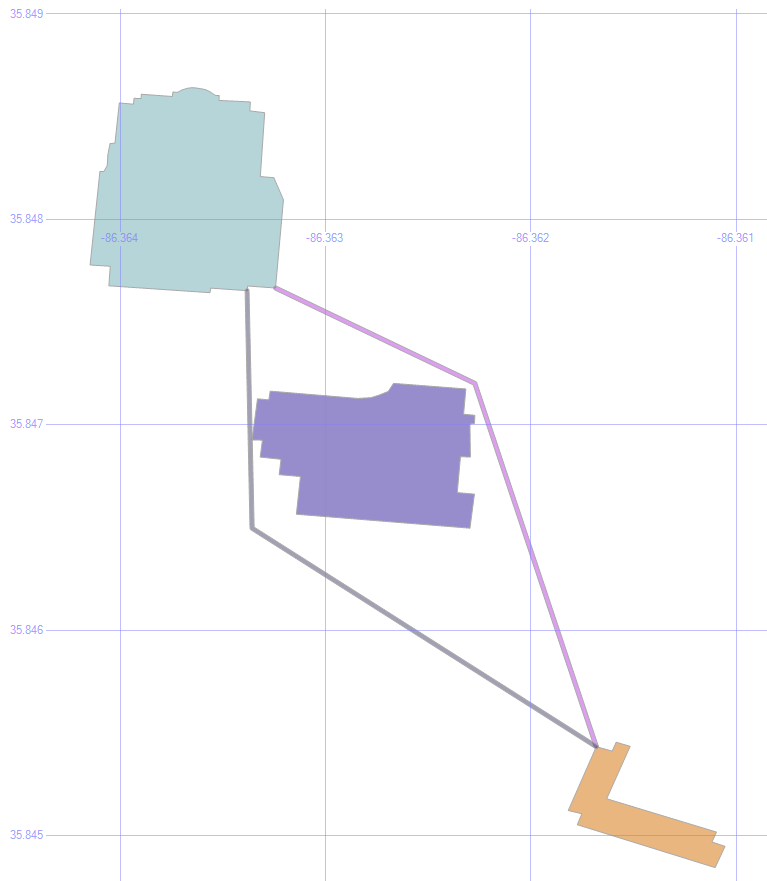
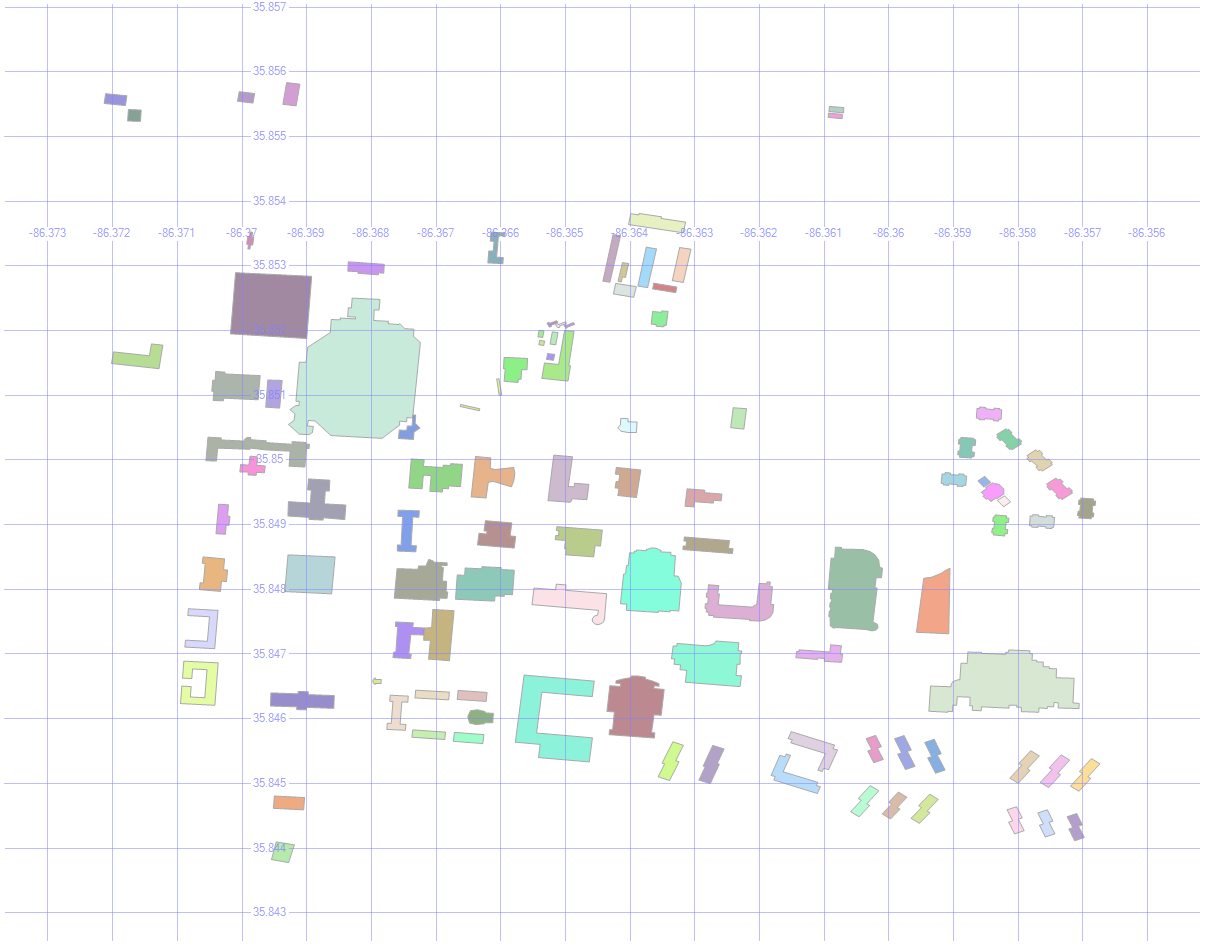
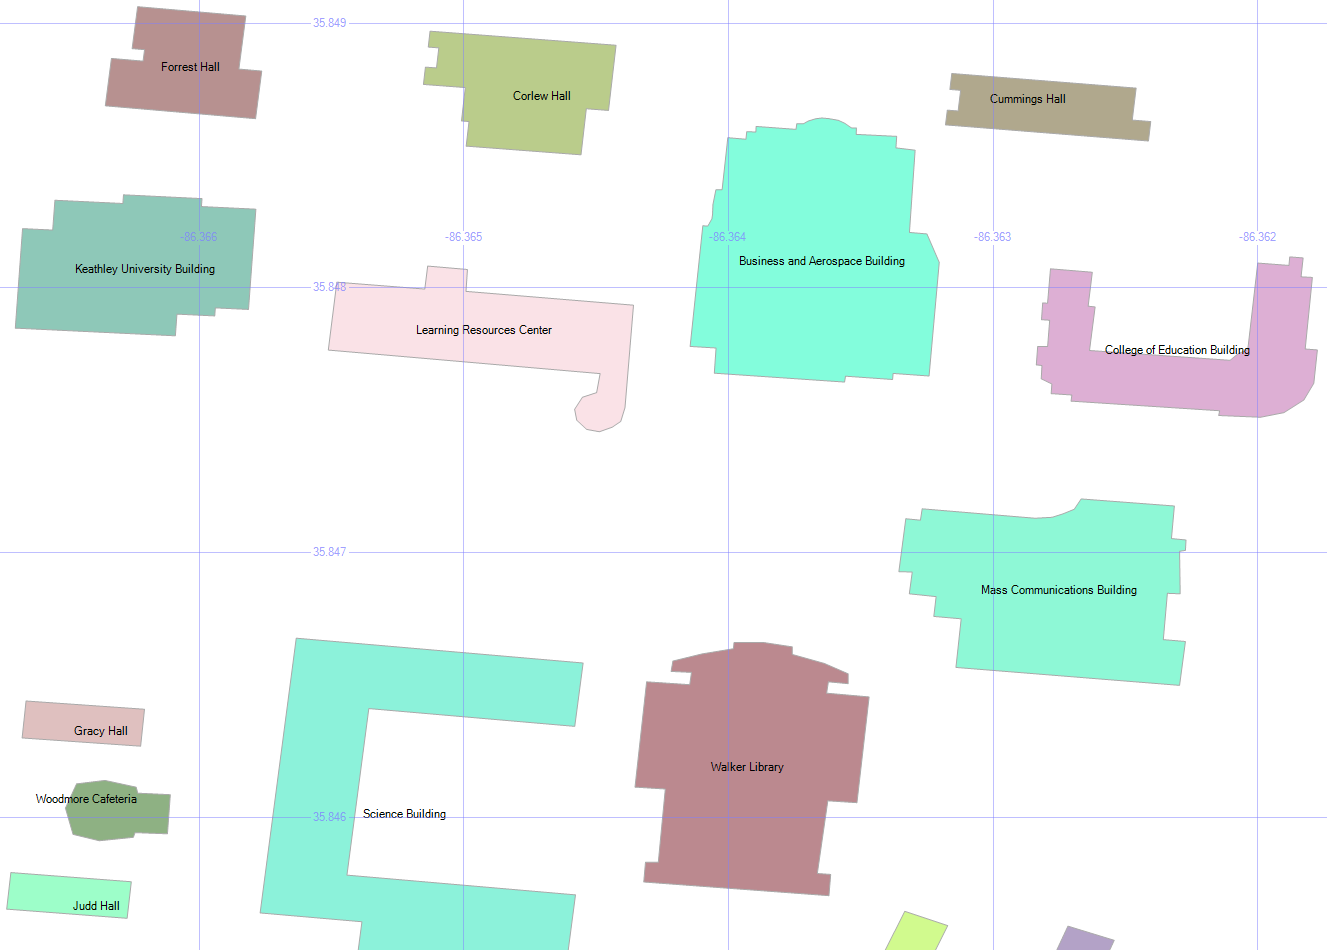
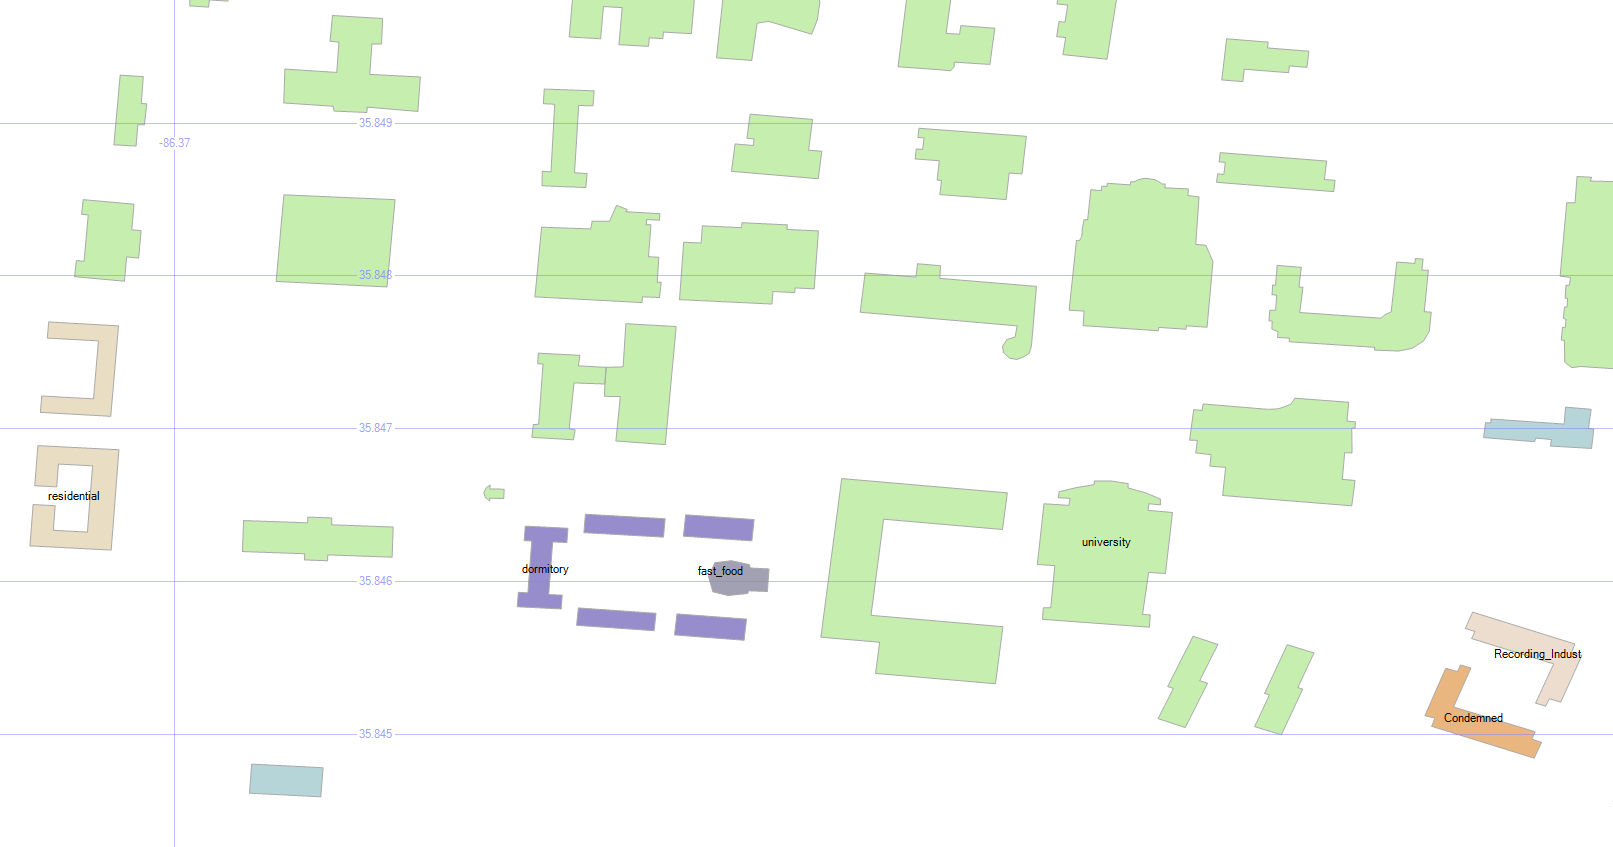
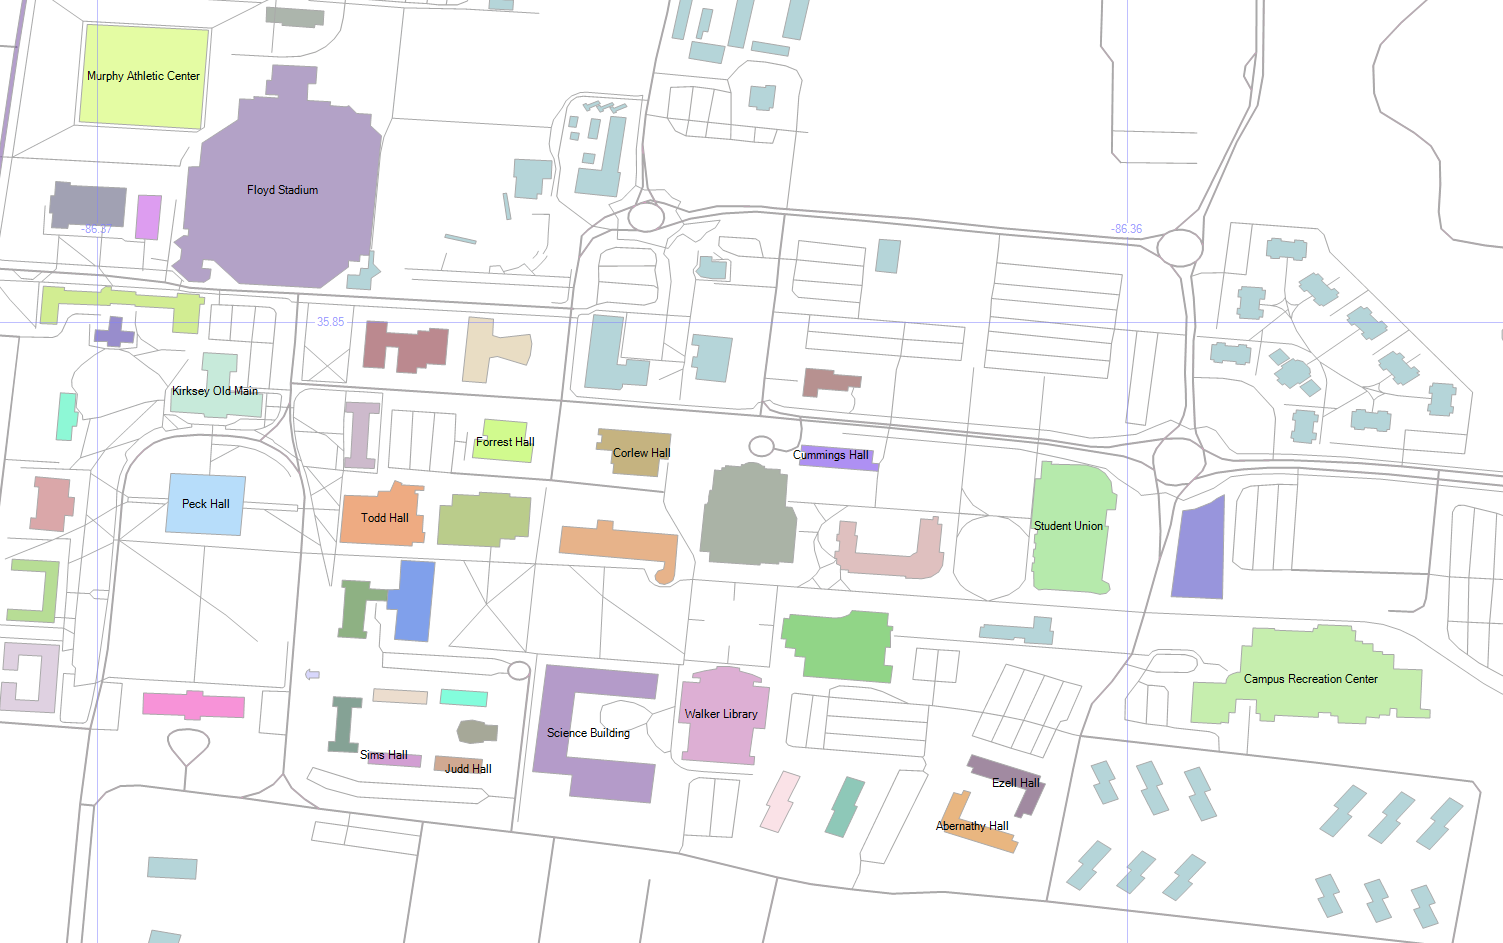
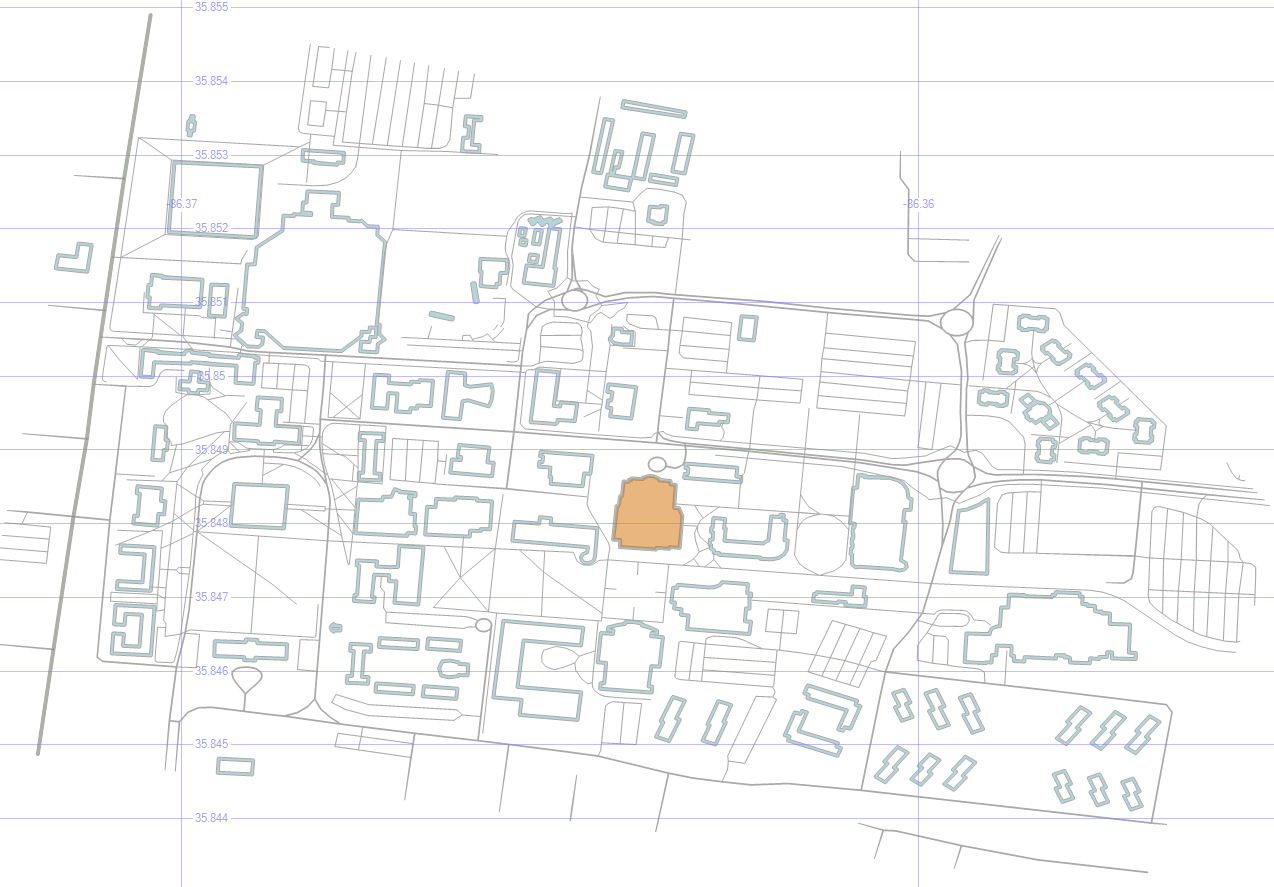
When I get specific local data including buildings (like I did for MTSU in Part 2), I prefer to use the service at bbbike.org, but MapSys gives an overview of the various ways to find and import geospatial data.

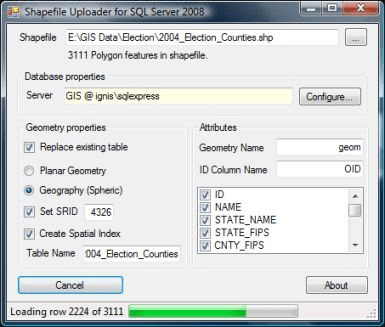
7. Loading Geospatial Data

The tool I prefer for load the data is Shape2SQL from SharpGIS. It’s lightweight and easy to use, and the instructions should handle whatever troubles you might run into.

The one thing to keep in mind is that if you’re loading geographical data, you’ll need to switch the datatype and pick and SRID (usually the default of 4326).

Shape2SQL

8. A Parting Gift

For a little fun, run this select:

select convert(geometry,'multipolygon (((0.0193705 0.678262, 0.0871671 0.678262, 0.164649 0.290852, 0.251816 0.629835, 0.329298 0.629835, 0.416465 0.281167, 0.493947 0.678262, 0.552058 0.678262, 0.455206 0.194, 0.377724 0.194, 0.290557 0.562039, 0.184019 0.194, 0.106538 0.194, 0.0193705 0.678262), (0.59037 0.678262, 0.658167 0.678262, 0.735649 0.290852, 0.822816 0.629835, 0.900298 0.629835, 0.987465 0.281167, 1.06495 0.678262, 1.12306 0.678262, 1.02621 0.194, 0.948724 0.194, 0.861557 0.562039, 0.755019 0.194, 0.677538 0.194, 0.59037 0.678262), (1.16137 0.678262, 1.22917 0.678262, 1.30665 0.290852, 1.39382 0.629835, 1.4713 0.629835, 1.55847 0.281167, 1.63595 0.678262, 1.69406 0.678262, 1.59721 0.194, 1.51972 0.194, 1.43256 0.562039, 1.32602 0.194, 1.24854 0.194, 1.16137 0.678262), (1.93576 0.329593, 2.06167 0.329593, 2.06167 0.203685, 1.93576 0.203685, 1.93576 0.329593), (2.70046 0.901022, 2.77795 0.901022, 2.77795 0.194, 2.70046 0.194, 2.70046 0.290852, 2.64235 0.223056, 2.59393 0.194, 2.56487 0.184315, 2.50676 0.184315, 2.46802 0.194, 2.42928 0.223056, 2.39054 0.271482, 2.36148 0.368334, 2.36148 0.465186, 2.38085 0.552354, 2.40991 0.610465, 2.45833 0.658891, 2.49707 0.678262, 2.52613 0.687947, 2.59393 0.687947, 2.64235 0.668576, 2.70046 0.62015, 2.70046 0.901022), (2.70046 0.562039, 2.70046 0.348964, 2.62298 0.271482, 2.58424 0.252111, 2.52613 0.252111, 2.48739 0.281167, 2.46802 0.310223, 2.44865 0.368334, 2.44865 0.484557, 2.46802 0.542668, 2.48739 0.581409, 2.51645 0.610465, 2.5455 0.629835, 2.60361 0.629835, 2.65204 0.60078, 2.70046 0.562039), (2.95185 0.658891, 3.01965 0.678262, 3.06807 0.687947, 3.17461 0.687947, 3.21335 0.678262, 3.25209 0.658891, 3.27146 0.629835, 3.29083 0.571724, 3.29083 0.271482, 3.30052 0.252111, 3.31989 0.242426, 3.35863 0.242426, 3.36832 0.203685, 3.32958 0.184315, 3.29083 0.184315, 3.25209 0.203685, 3.22304 0.252111, 3.1843 0.223056, 3.12619 0.194, 3.08745 0.184315, 3.02933 0.184315, 2.99059 0.194, 2.96154 0.21337, 2.93248 0.242426, 2.91311 0.290852, 2.91311 0.348964, 2.93248 0.39739, 2.98091 0.445816, 3.01965 0.465186, 3.08745 0.484557, 3.21335 0.484557, 3.21335 0.562039, 3.19398 0.60078, 3.14556 0.629835, 3.06807 0.629835, 3.00996 0.610465, 2.95185 0.581409, 2.95185 0.658891), (3.21335 0.436131, 3.12619 0.436131, 3.06807 0.41676, 3.02933 0.39739, 3.00028 0.348964, 3.00028 0.300538, 3.01965 0.271482, 3.05839 0.242426, 3.10682 0.242426, 3.16493 0.261797, 3.21335 0.300538, 3.21335 0.436131), (3.46474 0.678262, 3.55191 0.678262, 3.71656 0.281167, 3.88121 0.678262, 3.95869 0.678262, 3.74561 0.194, 3.66813 0.194, 3.46474 0.678262), (4.49579 0.41676, 4.15681 0.41676, 4.15681 0.368334, 4.17618 0.329593, 4.19555 0.300538, 4.24397 0.261797, 4.30208 0.242426, 4.37957 0.242426, 4.42799 0.252111, 4.49579 0.271482, 4.49579 0.21337, 4.42799 0.194, 4.36988 0.184315, 4.28271 0.184315, 4.23429 0.194, 4.16649 0.223056, 4.11806 0.261797, 4.08901 0.310223, 4.06964 0.378019, 4.06964 0.474872, 4.07932 0.523298, 4.09869 0.571724, 4.14712 0.629835, 4.19555 0.668576, 4.26334 0.687947, 4.34083 0.687947, 4.39894 0.668576, 4.43768 0.639521, 4.46673 0.60078, 4.4861 0.552354, 4.49579 0.494242, 4.49579 0.41676), (4.40862 0.474872, 4.15681 0.474872, 4.16649 0.523298, 4.18586 0.562039, 4.2246 0.610465, 4.26334 0.629835, 4.32145 0.629835, 4.3602 0.610465, 4.38925 0.581409, 4.40862 0.532983, 4.40862 0.474872), (4.62127 0.678262, 4.68906 0.678262, 4.68906 0.581409, 4.72781 0.639521, 4.76655 0.678262, 4.78592 0.687947, 4.83434 0.687947, 4.8634 0.658891, 4.88277 0.62015, 4.89245 0.581409, 4.92151 0.629835, 4.95057 0.668576, 4.98931 0.687947, 5.02805 0.687947, 5.0571 0.668576, 5.07647 0.639521, 5.08616 0.591094, 5.08616 0.194, 5.01836 0.194, 5.01836 0.591094, 4.98931 0.62015, 4.96994 0.62015, 4.9312 0.581409, 4.89245 0.513613, 4.89245 0.194, 4.82466 0.194, 4.82466 0.591094, 4.7956 0.62015, 4.77623 0.62015, 4.71812 0.562039, 4.68906 0.513613, 4.68906 0.194, 4.62127 0.194, 4.62127 0.678262), (5.23585 0.658891, 5.30365 0.678262, 5.35207 0.687947, 5.45861 0.687947, 5.49735 0.678262, 5.53609 0.658891, 5.55546 0.629835, 5.57483 0.571724, 5.57483 0.271482, 5.58452 0.252111, 5.60389 0.242426, 5.64263 0.242426, 5.65232 0.203685, 5.61358 0.184315, 5.57483 0.184315, 5.53609 0.203685, 5.50704 0.252111, 5.4683 0.223056, 5.41019 0.194, 5.37145 0.184315, 5.31333 0.184315, 5.27459 0.194, 5.24554 0.21337, 5.21648 0.242426, 5.19711 0.290852, 5.19711 0.348964, 5.21648 0.39739, 5.26491 0.445816, 5.30365 0.465186, 5.37145 0.484557, 5.49735 0.484557, 5.49735 0.562039, 5.47798 0.60078, 5.42956 0.629835, 5.35207 0.629835, 5.29396 0.610465, 5.23585 0.581409, 5.23585 0.658891), (5.49735 0.436131, 5.41019 0.436131, 5.35207 0.41676, 5.31333 0.39739, 5.28428 0.348964, 5.28428 0.300538, 5.30365 0.271482, 5.34239 0.242426, 5.39082 0.242426, 5.44893 0.261797, 5.49735 0.300538, 5.49735 0.436131), (5.9037 0.765429, 5.98119 0.765429, 5.98119 0.668576, 6.20395 0.668576, 6.20395 0.610465, 5.98119 0.610465, 5.98119 0.300538, 6.01024 0.261797, 6.06835 0.242426, 6.16521 0.242426, 6.21363 0.252111, 6.21363 0.194, 6.14583 0.184315, 6.02961 0.184315, 5.96182 0.203685, 5.93276 0.232741, 5.91339 0.261797, 5.9037 0.310223, 5.9037 0.610465, 5.7778 0.610465, 5.7778 0.668576, 5.9037 0.668576, 5.9037 0.765429), (6.4747 0.765429, 6.55219 0.765429, 6.55219 0.668576, 6.77495 0.668576, 6.77495 0.610465, 6.55219 0.610465, 6.55219 0.300538, 6.58124 0.261797, 6.63935 0.242426, 6.73621 0.242426, 6.78463 0.252111, 6.78463 0.194, 6.71683 0.184315, 6.60061 0.184315, 6.53282 0.203685, 6.50376 0.232741, 6.48439 0.261797, 6.4747 0.310223, 6.4747 0.610465, 6.3488 0.610465, 6.3488 0.668576, 6.4747 0.668576, 6.4747 0.765429), (7.16677 0.901022, 7.27331 0.901022, 7.27331 0.794484, 7.16677 0.794484, 7.16677 0.901022), (7.00212 0.678262, 7.26362 0.678262, 7.26362 0.194, 7.18614 0.194, 7.18614 0.62015, 7.00212 0.62015, 7.00212 0.678262), (7.51501 0.678262, 7.59249 0.678262, 7.59249 0.581409, 7.63123 0.629835, 7.67966 0.668576, 7.73777 0.687947, 7.79588 0.687947, 7.83462 0.678262, 7.87336 0.649206, 7.89273 0.610465, 7.90242 0.571724, 7.90242 0.194, 7.82494 0.194, 7.82494 0.552354, 7.80557 0.591094, 7.76683 0.610465, 7.7184 0.610465, 7.66997 0.591094, 7.59249 0.513613, 7.59249 0.194, 7.51501 0.194, 7.51501 0.678262), (8.42499 0.678262, 8.49279 0.678262, 8.49279 0.203685, 8.4831 0.145574, 8.46373 0.0971477, 8.43468 0.0584068, 8.39594 0.0293511, 8.34751 0.00998063, 8.29908 0.0002954, 8.21192 0.0002954, 8.16349 0.00998063, 8.11506 0.0196659, 8.11506 0.0874625, 8.18286 0.068092, 8.23129 0.0584068, 8.30877 0.0584068, 8.3572 0.0777772, 8.38625 0.106833, 8.41531 0.155259, 8.41531 0.300538, 8.37657 0.252111, 8.32814 0.21337, 8.27971 0.194, 8.21192 0.194, 8.16349 0.21337, 8.11506 0.252111, 8.08601 0.300538, 8.06664 0.368334, 8.06664 0.474872, 8.08601 0.552354, 8.12475 0.62015, 8.18286 0.668576, 8.24097 0.687947, 8.30877 0.687947, 8.37657 0.658891, 8.42499 0.62015, 8.42499 0.678262), (8.41531 0.562039, 8.41531 0.358649, 8.37657 0.310223, 8.33783 0.281167, 8.2894 0.261797, 8.25066 0.261797, 8.20223 0.290852, 8.17318 0.329593, 8.15381 0.39739, 8.15381 0.474872, 8.16349 0.523298, 8.19255 0.581409, 8.25066 0.629835, 8.31845 0.629835, 8.36688 0.60078, 8.41531 0.562039), (8.71512 0.901022, 8.98631 0.901022, 8.98631 0.194, 8.90883 0.194, 8.90883 0.84291, 8.71512 0.84291, 8.71512 0.901022), (9.17958 0.678262, 9.26675 0.678262, 9.4314 0.310223, 9.59605 0.678262, 9.66384 0.678262, 9.40234 0.0874625, 9.3636 0.0390363, 9.32486 0.0196659, 9.27644 0.00998063, 9.20864 0.00998063, 9.20864 0.068092, 9.28612 0.068092, 9.32486 0.0971477, 9.38297 0.21337, 9.17958 0.678262), (9.92976 0.329593, 10.0557 0.329593, 10.0557 0.203685, 9.92976 0.203685, 9.92976 0.329593), (10.37 0.678262, 10.4475 0.678262, 10.4475 0.581409, 10.4862 0.629835, 10.5347 0.668576, 10.5928 0.687947, 10.6509 0.687947, 10.6896 0.678262, 10.7284 0.649206, 10.7477 0.610465, 10.7574 0.571724, 10.7574 0.194, 10.6799 0.194, 10.6799 0.552354, 10.6606 0.591094, 10.6218 0.610465, 10.5734 0.610465, 10.525 0.591094, 10.4475 0.513613, 10.4475 0.194, 10.37 0.194, 10.37 0.678262), (11.3478 0.41676, 11.0088 0.41676, 11.0088 0.368334, 11.0282 0.329593, 11.0475 0.300538, 11.096 0.261797, 11.1541 0.242426, 11.2316 0.242426, 11.28 0.252111, 11.3478 0.271482, 11.3478 0.21337, 11.28 0.194, 11.2219 0.184315, 11.1347 0.184315, 11.0863 0.194, 11.0185 0.223056, 10.9701 0.261797, 10.941 0.310223, 10.9216 0.378019, 10.9216 0.474872, 10.9313 0.523298, 10.9507 0.571724, 10.9991 0.629835, 11.0475 0.668576, 11.1153 0.687947, 11.1928 0.687947, 11.2509 0.668576, 11.2897 0.639521, 11.3187 0.60078, 11.3381 0.552354, 11.3478 0.494242, 11.3478 0.41676), (11.2606 0.474872, 11.0088 0.474872, 11.0185 0.523298, 11.0379 0.562039, 11.076599999999999 0.610465, 11.1153 0.629835, 11.1735 0.629835, 11.2122 0.610465, 11.2413 0.581409, 11.2606 0.532983, 11.2606 0.474872), (11.6137 0.765429, 11.6912 0.765429, 11.6912 0.668576, 11.9139 0.668576, 11.9139 0.610465, 11.6912 0.610465, 11.6912 0.300538, 11.7202 0.261797, 11.7784 0.242426, 11.8752 0.242426, 11.9236 0.252111, 11.9236 0.194, 11.8558 0.184315, 11.7396 0.184315, 11.6718 0.203685, 11.6428 0.232741, 11.6234 0.261797, 11.6137 0.310223, 11.6137 0.610465, 11.4878 0.610465, 11.4878 0.668576, 11.6137 0.668576, 11.6137 0.765429)))',0)


Spatial Data, Part 4: Data Sets

This is part four in a series:

Besides just looking around at geographical features like states, roads, and buildings, we can incorporate human-centric data like restaurants, crimes, and more.

Data Sets

1. Toxic Release Inventory

A “TRI” as reported by the EPA is a Toxic Release Inventory. This could be a chemical spill or some other accident that’s not in our best health interests. Here are the incidents that took place in Kentucky over a ten-year period.

select geometry::CollectionAggregate(geom)
from ky_counties
union all
select geom.STBuffer(.05)
from ky_tri
where geom.STWithin((select geom from us_stateshapes where state = 'KY')) = 1

The EPA offers an interactive map of TRI’s around the country here.

TRIs in KY

2. Toxic Incidents in Jefferson County

select geometry::CollectionAggregate(geom).STBuffer(.001)
from ky_interstates where geom.STWithin((select geom from ky_counties where id = 24)) = 1
union all 
select geometry::CollectionAggregate(geom) from ky_counties where id = 24
union all
select geom.STBuffer(.01) from ky_tri where geom.STWithin((select geom from ky_counties where id = 24)) = 1

Bringing it close to home, here are the incidents that have taken place in my own hometown of Louisville, KY.

TRIs in Jefferson County

3. Add in the Sirens

select geometry::CollectionAggregate(geom).STBuffer(.001)
from ky_interstates where geom.STWithin((select geom from ky_counties where id = 24)) = 1
union all 
select geom from ky_counties where id = 24
union all
select geometry::UnionAggregate(geom.STBuffer(.01)) from ky_tri where geom.STWithin((select geom from ky_counties where id = 24)) = 1
union all
select geometry::UnionAggregate(geom.STBuffer(.02)) from ky_sirens

The siren radius is an estimate, since the hearing distance can depend on a lot of factors. Still, it’s disturbing to see that there are some parts of the county that have had several incidents but have no sirens for tens of miles. The I-65 corridor on the southern half of Louisville has its share of problems, but no active alert system.

TRIs with Sirens

4. Toxic Incidents per County

;with tox (id, ct) as
(select c.id, count(*) from ky_counties c join ky_tri t on c.geom.STContains(t.geom) = 1 group by c.id)
select c.geom, isnull(tox.ct,0) Incidents
from ky_counties c
left outer join tox on c.id = tox.id

By counting the number of incidents per county in a CTE, and joining that to the county map, we can display that number on the SQL map.

On the good side, it’s good to see that there are several counties with zero incidents; on the bad side, 73 in my county? Ouch.

TRIs per County

5. Toxic Incident Range Bands

select geometry::CollectionAggregate(geom), '0' Incidents
from ky_counties c where c.id not in (select id from tox) union all
select geometry::CollectionAggregate(geom), '< 5'
from ky_counties c inner join tox on tox.id = c.id where tox.ct < 5 union all
select geometry::CollectionAggregate(geom), '5 - 10'
from ky_counties c inner join tox on tox.id = c.id where tox.ct between 5 and 10 union all
select geometry::CollectionAggregate(geom), '11 - 25'
from ky_counties c inner join tox on tox.id = c.id where tox.ct between 11 and 25 union all
select geometry::CollectionAggregate(geom), '> 25'
from ky_counties c inner join tox on tox.id = c.id where tox.ct > 25

Seeing the individual numbers is informative, but divvying up the data into range bands can make it easier to find patterns and trends.

TRIs with Range Bands

Since we aggregated the counts into just five range bands, they’re considered just five objects, and therefore only five labels appear.

The southeast part of the state looks pretty good, with mostly light blue zeros and a scattering of tan lows. There’s an almost solid dark blue of tens riding up along I-75. And, if I had to present this kind of bad news to my boss, you can see that I’ve cleverly downplayed Louisville’s 73 TRIs into an “over 25” category.

6. Low Food Scores

;with s (id, dt) as
(select establishmentid, max(inspectiondate) from ky_food
where typedescription = 'food service' group by establishmentid)
select geom.STBuffer(.01) Geom, establishmentname + ': ' + convert(varchar,f.score) Name
from ky_food f 
inner join s on f.establishmentid = s.id and f.inspectiondate = s.dt
where score < 90
union all
select geometry::CollectionAggregate(geom), ''
from ky_interstates where geom.STWithin((select geom from ky_counties where id = 24)) = 1
union all
select geom.STBoundary(), '' from ky_counties where id = 24

Instead of the bad stuff that we may inadvertently breathe and drink due to industrial accidents or chemical spills, let’s look at the bad stuff that we put into our bodies on purpose. Here are the restaurant health inspection codes (usually the “A” papers that we see posted) that are not up to the A level (score < 90).

Here, I’m plotting the low-grade restaurants (using a CTE because I only want the most recent inspection date for each restaurant) around the city, and setting the hover-text to be the name and score.

Low Food Scores

The data I’m using is from early 2015. So Phi Binh Minh (and the others) might have an “A” in the window these days. Don’t take my map as a food critic review.

7. Violent Crimes in Jefferson County

select geom.STBuffer(.001), left(Crime,1) Crime, convert(varchar,IncidentDate,111) Date
from ky_crime
where geom.STWithin((select geom from ky_counties where id = 24)) = 1
and crime in ('homicide', 'aggravated assault', 'simple assault') and year(incidentdate) = 2014
union all
select geometry::CollectionAggregate(geom), null, null
from ky_interstates where geom.STWithin((select geom from ky_counties where id = 24)) = 1
union all
select geom.STBoundary(), null, null from ky_counties where id = 24

More bad news! Sorry.

Here are the violent crimes in town (thankfully, relatively few homicides) over the course of a year, with the first letter of each of those crimes in our hover-text.

Louisville Violent Crimes

The west end, downtown, and the airport region seem to have the worst of it.

8. Violent Crimes in Jefferson County with Bubble Sizes

;with siz (lat, lon, sz) as
(select latitude, longitude, count(*) size from ky_crime where crime in ('homicide', 'aggravated assault', 'simple assault') group by latitude, longitude)
select geom.STBuffer(sz * .0003) from ky_crime c 
inner join siz on c.latitude = siz.lat and c.longitude = siz.lon
where crime in ('homicide', 'aggravated assault', 'simple assault')
and geom.STWithin((select geom from ky_counties where id = 24)) = 1 and sz > 1
union all
select geometry::CollectionAggregate(geom)
from ky_interstates where geom.STWithin((select geom from ky_counties where id = 24)) = 1
union all
select geom.STBoundary() from ky_counties where id = 24

Instead of just seeing where they are, how about we highlight the dangerous parts of town by making each dot (an address where a crime happened) wider for every crime that happened there, and ignore the dots where only one crime happened. The previous maps showed us which parts of town are dangerous, but this shows us which specific places are “repeat customers” for crimes.

KY Crime Bubbles

Of course, even one violent crime is too many. And my filename for this image (KY Crime Bubbles) sounds like a street gang made up of clowns or janitors.

The underlying data shows that one of the larger circles could actually be removed. The puke-green circle around the center of the second grid square is some sort of default address for the city. The address is listed simply as “Louisville Metro.” Even so, we learn a lot by plotting our own data on a map like this.

9. Reported Crimes (Bad Geo)

select geom.STBuffer(.5), crime, convert(varchar,IncidentDate,111) Date
from ky_crime
where geom.STWithin((select geom from us_stateshapes where state = 'KY')) = 0
union all
select geometry::CollectionAggregate(geom), null, null from us_stateshapes

So far, I’ve been limited the data displayed just to what happens within Louisville/Jefferson County, but sometimes crimes get reported to the Louisville Metro Police that take place out of town.

Bad Geo

Oh, and there are a lot of crimes (32 of them, not all that many compared to the overall volume, really) that happen way out in the middle of the ocean. Actually, no. That’s location 0, 0 (one of those 0’s is the equator, and the other is the prime meridian, which is also where the GMT time zone starts). If no geodata was recorded with the incident, many systems will default it to there. For data like that, you can ignore it or correct it by geocoding it (assigning a latitude and longitude to an address). There are some services that will do that for free, for a given amount of addresses (google maps will geocode 10,000 per day, for example), and other services that will geocode for a fee.

Data Sources

Here are the data sets use for this lesson (the us_stateshapes, ky_counties, and ky_interstates have appeared previously.)

  • TRI data is here.
  • Siren, food, and crime data (and dozens of other Louisville data sets) are here.

Getting Involved

I encourage all of you to join in this year’s National Day of Civic Hacking, which is sponsored by the White House’s data.gov open data portal. It’s an annual event put on by the Code for America Brigade to build apps in a single day with other local coders / designers / data’ers, primarily based on using open data sets.

In Louisville, in the past few years, we’ve had apps that:

Your area might also have a chapter of MapTime, which uses and enhances geodata in a variety of ways.

Spatial Data, Part 3: Getting Around

This is part three in a series:

Now that we have some local buildings represented in our database, let’s move around.

Getting Around

0. Get the Buildings

In the last step of Part 2, we saved three buildings into temp tables — #orig, #bloc, and #dest.

MSTU Buildings

1. Shortest Path

select geom from #orig union all select geom from #dest union all select geom from #bloc union all
select (select geom from #orig).ShortestLineTo((select geom from #dest))

Let’s Find the Shortest Path to that Condemned Building.

The .ShortestLineTo method will find the shortest path, even taking into account the shapes of the buildings.

Shortest Line

But it doesn’t care about any obstacles in its path, which is why we also stored that blocking building to continue our experiment.

2. Put an Envelope on the Obstacle

select (select geom from #bloc).STEnvelope().STBoundary()
union all select geom from #orig union all select geom from #dest union all select geom from #bloc

An envelope will look at the highest and lowest values for the height and the width of an object, and draw a box using those values. We can use this to help find a path around the obstacle.

Envelope

3. Draw the Corners of the Envelope

select geom from #orig union all select geom from #dest union all select geom from #bloc union all
select geometry::Point((select geom from #bloc).STEnvelope().STPointN((1)).STX, (select geom from #bloc).STEnvelope().STPointN((3)).STY, 0).STBuffer(.0001) union all
select geometry::Point((select geom from #bloc).STEnvelope().STPointN((3)).STX, (select geom from #bloc).STEnvelope().STPointN((3)).STY, 0).STBuffer(.0001) union all
select geometry::Point((select geom from #bloc).STEnvelope().STPointN((3)).STX, (select geom from #bloc).STEnvelope().STPointN((1)).STY, 0).STBuffer(.0001) union all
select geometry::Point((select geom from #bloc).STEnvelope().STPointN((1)).STX, (select geom from #bloc).STEnvelope().STPointN((1)).STY, 0).STBuffer(.0001)

This command illustrates where the corners of that envelope are. After all, we don’t really want the entire envelope to find a way around the obstacle, just the endpoints.

Envelope Corners

4. Save Those Corners

if object_id('tempdb.dbo.#corn', 'u') is not null drop table #corn create table #corn (geom geometry)
insert into #corn
select geometry::Point(geom.STEnvelope().STPointN((1)).STX, geom.STEnvelope().STPointN((3)).STY, 0) from #bloc
union all
select geometry::Point(geom.STEnvelope().STPointN((3)).STX, geom.STEnvelope().STPointN((3)).STY, 0) from #bloc
union all
select geometry::Point(geom.STEnvelope().STPointN((3)).STX, geom.STEnvelope().STPointN((1)).STY, 0) from #bloc
union all
select geometry::Point(geom.STEnvelope().STPointN((1)).STX, geom.STEnvelope().STPointN((1)).STY, 0) from #bloc

Let’s save those into some temp tables, too, to make the following statements a bit easier to read.

5. Paths to the Corners

select geom from #orig union all select geom from #dest union all select geom from #bloc union all
select o.geom.ShortestLineTo(c.geom).STBuffer(.00001) from #orig o left outer join #corn c on 1=1

Being a method, the .ShortestLineTo can be applied to as many shapes (or points) that we want to give it, all in a single command.

By putting the corners into a temp table, we can draw all four lines at once.

Origin Paths

6. Eliminate Overlaps

select geom from #orig union all select geom from #dest union all select geom from #bloc union all
select o.geom.ShortestLineTo(c.geom).STBuffer(.00001)
from #orig o left outer join #corn c on 1=1 left outer join #bloc b on 1=1
where o.geom.ShortestLineTo(c.geom).STIntersects(b.geom)=0

One of those paths goes through the building, which isn’t any help in getting around it. So by added a where clause so that .STIntersects is false, we only see the lines that don’t collide with the building.

MSTU Valid Paths

Cool! We’re halfway there.

7. Add the Destination

select geom from #orig union all select geom from #dest union all select geom from #bloc union all
select o.geom.ShortestLineTo(c.geom).STUnion(c.geom.ShortestLineTo(d.geom)).STBuffer(.00001)
from #orig o left outer join #corn c on 1=1 left outer join #bloc b on 1=1 left outer join #dest d on 1=1
where o.geom.ShortestLineTo(c.geom).STIntersects(b.geom)=0
and c.geom.ShortestLineTo(d.geom).STIntersects(b.geom)=0

Since those three valid paths are also just geometric data objects, we can use them as the new “origin” for the next leg of our journey.

So, by finding the shortest lines from those lines to the destination building, joining the two line segments into a single object with the .STUnion method, we get:

Full Paths

If we were to apply the .STDistance() method to those paths, we’d see that the purplish path is 4.732 meters, and the blueish path is 5.055 meters.

Shortest Path

Typically, of course, the shortest path problem is focused on roads, not taking shortcuts through the grass.

That’s already been solved in a variety of ways. The most common approach is Dijkstra’s Algorithm.

Here are a couple of SQL implementations: one from Peter Larsson, and one from Hans Olav.

The key to making it quick is generally to pre-calculate all the distances. To a point. Computers these days can’t store the distance from every point on Earth to every other point on Earth, any more than every possible chess move on every board.


Spatial Data, Part 2: Local Data

This is part two in a series:

Besides just looking around at states, roads, rivers, and other large-scale features, we have the ability to bring in the structures that we all know and love because they’re right there with us.

Local Data

1. Buildings

Here are the buildings on MSTU Murfreesboro’s campus (which is where I first gave this presentation).

select id, geom, name, [type]
from mstubuildings

This brings back all the buildings on campus.

MSTU Campus

By picking Name as the label, and zooming in enough to where the text is readable, we get this:

MSTU Building Names

2. Building Types

select geometry::CollectionAggregate(geom), [type]
from mstubuildings
group by type

We can group the buildings so that they’re color-coded by type. There are lots of university buildings as expected, and a few other types.

Wait, what’s that brownish building in the bottom right? Condemned? Well, I never!

MSTU Building Types

Don’t worry — the campus isn’t in any danger. It’s just the old dorm.

3. How Many Roads Must a Man Walk Down?

select id, geom, name, [type]
from msturoads

Besides the buildings, we can display the roads.

MSTU Roads

4. Road Types

select geometry::CollectionAggregate(geom), [type]
from msturoads
group by type

There are a lot of “roads” on the map above, but not all of them are what we’d often consider to be a road. So let’s group them by type and see what they are.

MSTU Road Types

The labels come back really tiny, but the blueish top left is pedestrian, the blueish top center is footway, the purplish on the right is service, the pinkish is residential, with primary on the bottom center, and secondary in the bottom right.

5. Road Sizes

if object_id('tempdb.dbo.#roads', 'u') is not null drop table #roads
create table #roads (typ varchar(20), siz float)
insert #roads select 'primary',    .00004
insert #roads select 'secondary',  .00002
insert #roads select 'tertiary',   .00001
insert #roads select 'residential',.000005
insert #roads select 'service',    .0000005
insert #roads select 'footway',    .0000001
insert #roads select 'pedestrian', .0000001
insert #roads select 'steps',      .00000001
select geometry::CollectionAggregate(geom).STBuffer(siz), [type]
from msturoads
inner join #roads on type = typ
group by [type], siz

Let’s change the size of the roads to match a little more closely with what we’d expect.

My unscientific guess is that primary > secondary > tertiary > residential > service > footway > pedestrian > steps. So the temp table above will apply those sizes to the roads via STBuffer, and aggregating them will make them a single color.

MSTU Road Sizes

It looks more like a human-readable roadmap, anyway.

6. Aggregated Buildings and Roads

select geometry::CollectionAggregate(geom), name, ''
from mstubuildings
group by name
union all
select geometry::CollectionAggregate(geom).STBuffer(siz), '', [type]
from msturoads
inner join #roads on type = typ
group by [type], siz

Now, let’s put the buildings and (sized) roads together, and choose Name as the label for the buildings.

MSTU Buildings and Roads

7. Cleaning Up

if object_id('tempdb.dbo.#camp','u') is not null drop table #camp
create table #camp (geom geometry)
insert into #camp (geom)
select geometry::STPolyFromText('POLYGON ((-86.371 35.855, -86.36 35.853, -86.355 35.848, -86.357 35.843, -86.373 35.845, -86.371 35.855))', 0)
select geometry::CollectionAggregate(geom), name, ''
from mstubuildings
group by name
union all
select geometry::CollectionAggregate(geom).STBuffer(siz), '', [type]
from msturoads
inner join #roads on type = typ and siz >= .0000005
group by [type], siz
union all
select geom.STBoundary().STBuffer(.0002), null, null
from #camp

But remember, we’re not just painting a picture — this is queryable data.

So dropping the not-really-roads (footway, pedestrian, steps), and drawing a homemade polygon around the campus, we’re getting closer to a more usable map.

MSTU Boundary

8. Trim the Map

select 0, geometry::CollectionAggregate(geom).STIntersection((select geom from #camp)).STBoundary().STBuffer(.00002), '', ''
from mstubuildings
union all
select id, geom, name, [type]
from mstubuildings
where id = 22
union all
select 0, geometry::CollectionAggregate(geom).STIntersection((select geom from #camp)).STBuffer(siz), '', [type]
from msturoads
inner join #roads on type = typ
group by [type], siz

That polygon doesn’t have to be just for show — we can use it as a filter to only show the geometry that is within it, which “chops away” the parts of the map that we don’t care about.

To highlight a particular building (the Business and Aerospace Building which hosted SQL Saturday 480), just change the buildins into outlines via STBoundary, and union in that one building as-is.

MSTU Cropped with Building Highlight

9. Pick Three Buildings

select id, geom, name, [type]
from mstubuildings
where id in (22, 38, 40)
union all
select 0, geometry::CollectionAggregate(geom).STIntersection((select geom from #camp)).STBoundary(), '', ''
from mstubuildings

Okay, now let’s pick just a couple of buildings to focus on. The BAB, the condemned building, and that building in between.

MSTU Building Focus

10. Save the Buildings for Later

if object_id('tempdb.dbo.#orig','u') is not null drop table #orig create table #orig (geom geometry)
if object_id('tempdb.dbo.#dest','u') is not null drop table #dest create table #dest (geom geometry)
if object_id('tempdb.dbo.#bloc','u') is not null drop table #bloc create table #bloc (geom geometry)
insert into #orig select geom from mstubuildings where id = 22
insert into #dest select geom from mstubuildings where id = 38
insert into #bloc select geom from mstubuildings where id = 40

select geom from #orig union all select geom from #dest union all select geom from #bloc

Let’s save those three buildings for later, and select just them.

MSTU Buildings


In the next post, we’ll use these buildings as we look at ways to get from place to place.

Downloads

Here’s the Excel file with the scripts to create and load the road and building tables.


Spatial Data, Part 1: Introduction

One of my favorite things about SQL is spatial data.

By using the datatypes geography and geometry, we can learn things about the facts and figures that we’re looking though that we might not have noticed without mapping.

Here are some of the basics of how to look at spatial data. Once we’ve gone through these building blocks, we’ll look at some of the things we can do with it.

This is part one in a series:

Introduction

Now, let’s kick the tires and see what spatial data is about.

1. Geospatial Data

select state, geom, geom.ToString() geomtext from us_stateshapes

This command selects the field called geom, which is of data type geometry. It also selects the geom field in string format.

Geom Text

The string results are shown as polygons and multipolygons.

Next to the Results tab is a Spatial Results tab.

States

Right there in SQL Server Management Studio (SSMS), we see a picture of the US!

Clicking the Label Column adds the state abbreviation to the map as well, and the Grid Lines checkbox toggles whether or not the latitude and longitude lines are visible.

State Labels

2. Where Clause

select state, geom from us_stateshapes where state not in (‘AK’,‘HI’)

Since this is just a T-SQL statement, you can exclude some states or show only specific ones.

Continental

select state, geom from us_stateshapes where state = 'KY'

KY

3. Combine Shapes

select geometry::UnionAggregate(geom) from us_stateshapes where state not in ('AK','HI')

All of the states can be combined into a single shape by using the UnionAggregate function.

Country

Now it doesn’t quite look like a rainbow vomited onto the map.

4. Combine Shapes with Outlines

select geometry::CollectionAggregate(geom) from us_stateshapes where state not in ('AK','HI')

The outlines of each state can be retained by using the CollectionAggregate instead.

State Lines

5. Highlight a State

select geometry::UnionAggregate(geom)
from us_stateshapes
where state not in ('AK','HI','KY')
union all
select geom from us_stateshapes where state = 'KY'

By filtering out a state and aggregating the rest of the country into a single color, then unioning that missing state back in, we can essentially change that state’s color.

KY Highlighted

6. County Detail

select geometry::CollectionAggregate(geom)
from ky_counties

“Zooming in” a bit, and reading from the counties table, we can see all the counties in Kentucky.

KY Counties

It’s just as easy to highlight a county, with or without the other counties being outlined.

select geom
from us_stateshapes
where state = 'KY'
union all
select geom
from ky_counties
where id = 24

KY with Jefferson County

9. Life is a Highway

select s.geom from us_stateshapes s where s.state = 'KY'
union all
select geometry::CollectionAggregate(i.geom) from us_stateshapes s
left outer join ky_interstates i on 1=1
where s.state = 'KY' and i.geom.STIntersects(s.geom) = 1

Need to find your way around? Add the interstates to the map.

KY Interstates

8. Zip Codes

select geom
from ky_counties
where id = 24
union all
select geometry::CollectionAggregate(geom)
from ky_zip

Zooming in a bit more, here are the zip codes within Jefferson County.

Jefferson County Zip Codes

They’re a lot more… disjointed than I expected them to be.

9. Bubbleland

select geom.STIntersection(geometry::Point(-89.5,36.53,0).STBuffer(.3))
from us_stateshapes
where state in ('ky','tn','mo') 
union all 
select geom.STBoundary().STIntersection(geometry::Point(-89.5,36.53,0).STBuffer(.3)).STBuffer(.005)
from us_stateshapes
where state in ('ky','mo')

Here’s a strange place in Kentucky…

Bubbleland, as it’s been nicknamed, is a place in Kentucky that can only be accessed (by land) from Tennessee.

Bubbleland

You can read more about Bubbleland here.

In the next post, we’ll look at local roads and buildings.

Downloads

Here’s the Excel file with the scripts to create and load the road and building tables.

Special Characters in SQL Server

Databases sometimes get unexpected characters in their data.

If your customer’s name is “José” but you search for “Jose”, you won’t (by default) find him.

Here’s a simple way to take care of that in your SQL database, without changing the data that you have.

select 'áàâãäåāăąćĉċčďđéëêèēĕėęĝğġģĥħìíîïĩīĭįıĵķĺļľłñńņňòóôõöōŏőơŕŗřśŝşšţťŧùúûüũūŭůűųưŵŷźżž'
select 'áàâãäåāăąćĉċčďđéëêèēĕėęĝğġģĥħìíîïĩīĭįıĵķĺļľłñńņňòóôõöōŏőơŕŗřśŝşšţťŧùúûüũūŭůűųưŵŷźżž' Collate SQL_Latin1_General_CP1253_CI_AI
select 'ĥéĺłô ŵòŕľđ' Collate SQL_Latin1_General_CP1253_CI_AI

Using Collate SQL_Latin1_General_CP1253_CI_AI, you can leave all the accents in your data, but still treat it like it’s all made up of “normal” characters.

It’s also great as you’re transferring data from one system to another, if the second system can’t handle those characters because of technology or programming limitations.

Master Data

Master Data Management (MDM) is a way of keeping your data accurate.

I’ve spoken about MDM at companies, technology groups, business groups, database groups, conferences, college classes, and more.

Here’s the general overview that I typically give (download the PowerPoint file).

Overview

“Too much information is driving me insane.” (Too Much Information, The Police, 1981)

“Two men say they’re Jesus. One of them must be wrong.” (Industrial Disease, Dire Straits, 1982)

“A man with one watch always knows what time it is. A man with two watches is never sure.” (San Diego Union, Lee Segall, 9/30/1930)

To master your data, take these steps:

  • look at each record of incoming data
  • standardize the formatting (phone numbers, addresses, etc.)
  • validate that it is allowable in your system (sure, 1/1/1900 is a real birthdate, but is it really the date that you made a sale?)
  • have a human being look through the edge cases (this John Smith might be the same as that other John Smith)
  • integrate the good/new/updated record into your master
  • communicate the update/entry to any systems that are interested

Benefits

When this is done, it opens up many possibilities for improvement.

When you know that your data is correct, you can:

  • govern it (lock down who can add/change data, and make it adhere to your own rules)
  • synchronize it (keep all your systems in tune with each other)
  • centralize it (set up a single master ID that keeps pointers to other systems and IDs)
  • log it (see how and when data changed, and which system and person did it)
  • analyze it (for meaningful results)
  • mine it (for unexpected insights)
  • act on it (make faster and better decisions)
  • enrich it (roll in data from outside sources like the Better Business Bureau, US Census Bureau, and others)
  • adapt it (if you acquire a new company, merging their data with your becomes much more manageable)
  • scale it (if you need to process 100x more information, it becomes a matter of adding new hardware as needed)

Horizon

Once it’s all running smoothly, you could also:

  • improve retention by finding existing customers who feel ignored
  • prevent fraud by comparing new data with old, according to patterns that you expect
  • minimize returned mail and packages by ensuring that addresses are accurate
  • identify your best customers (least effort, most profit = cash cows) and keep them happier
  • find mismatched data (do John Sr, John Jr, and John III all live at the same address? separate them)
  • absorb new sources and new types of data easily
  • stop wasting time with yoyos (customers who come and go and come and go)
  • find the key influencers in your network of customers and leads
  • grab the low-hanging fruit (least effort, big payoff)

Download the slides here