For those who’ve wondered what a National Day of Civic Hacking is like, here’s a post from Stan Siranovich that covers his (and my) experience at last weekend’s event.

A Day at the Louisville 4th Annual Hack for Change
Stan Siranovich – Data Scientist | Data Analyst – Specializing in Chemical and Biological, Laboratory, Manufacturing and IoT Applications
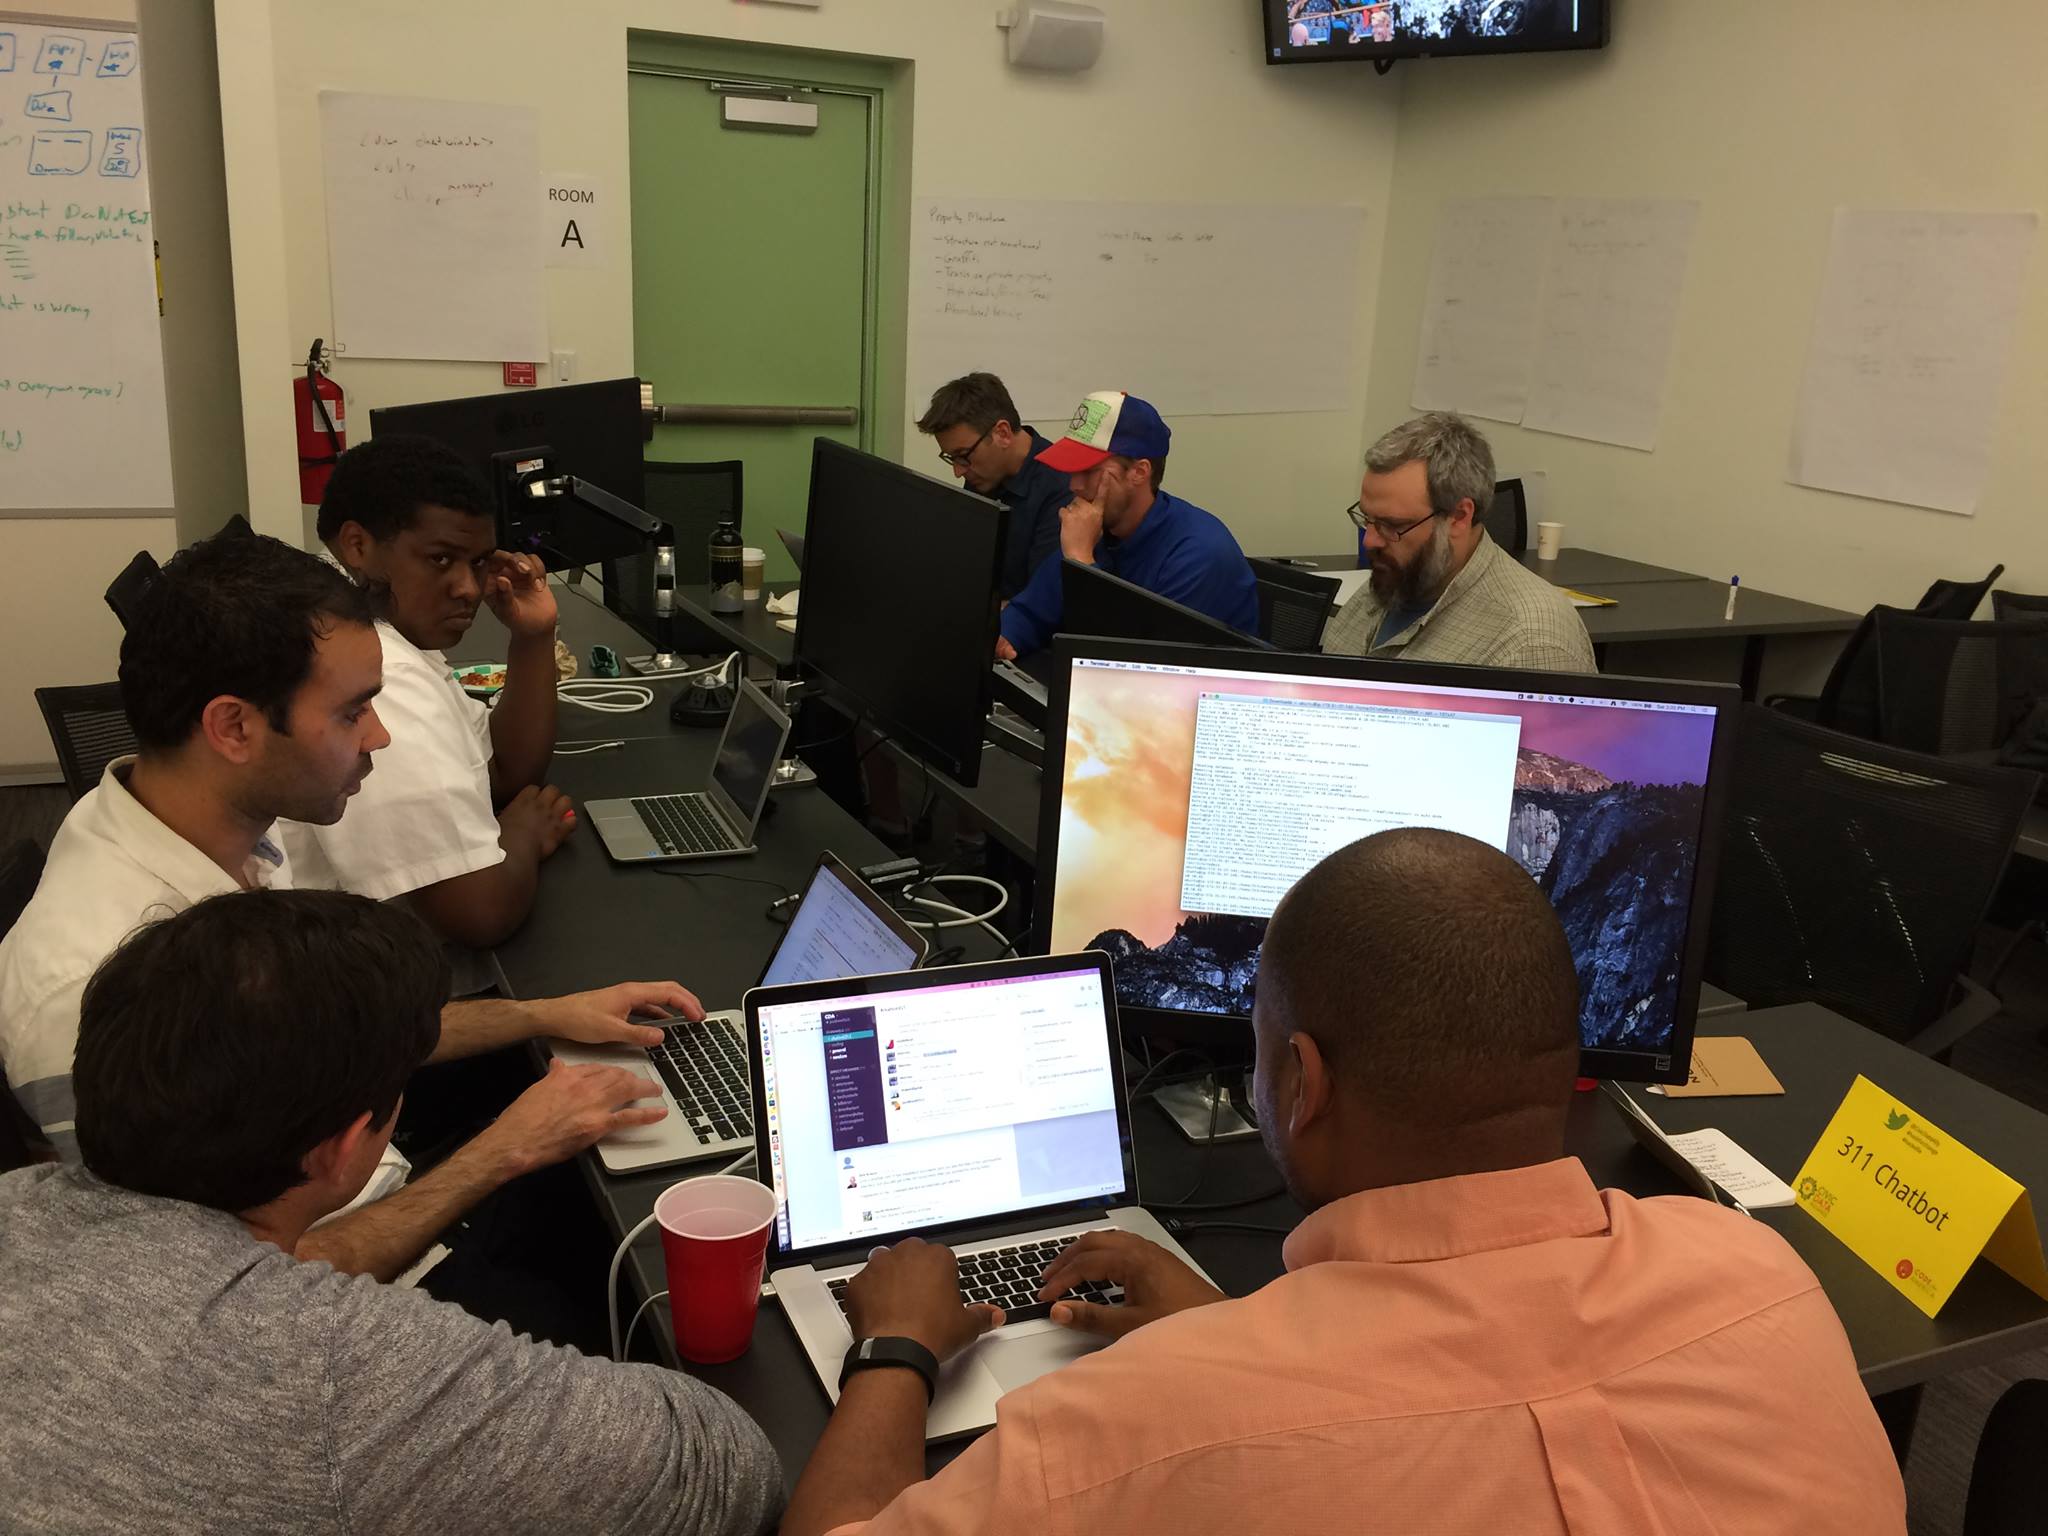
Ever wondered what’s it’s like to go to one of those all-day hacking events? I did too and wanted to find out. So when the Louisville 4th Annual Hack for Change came up I registered and went. Here is what I found out when I arrived…
This particular hack was going to work on several different projects, and after an intro and brief project description by Michael Schnuerle, and a break for some coffee and donuts, we moved into the various project groups.
Some of the projects were:
- A 311 Chatbot to allow easy submission of issues to the city of Louisville (h/t to the OPI and Innovation Office of Louisville Metro Government)
- An Analysis of KY Voting Precincts, including senate and house boundaries and voter record data
- A CityVoice deployment for Louisville Metro on the Dixie Highway Revitalization Project
- An analysis and visualization of Bicycle Accident data in the Louisville and Southern Indiana metro area
(for more details please visit the 4th Annual Hack for Change link)
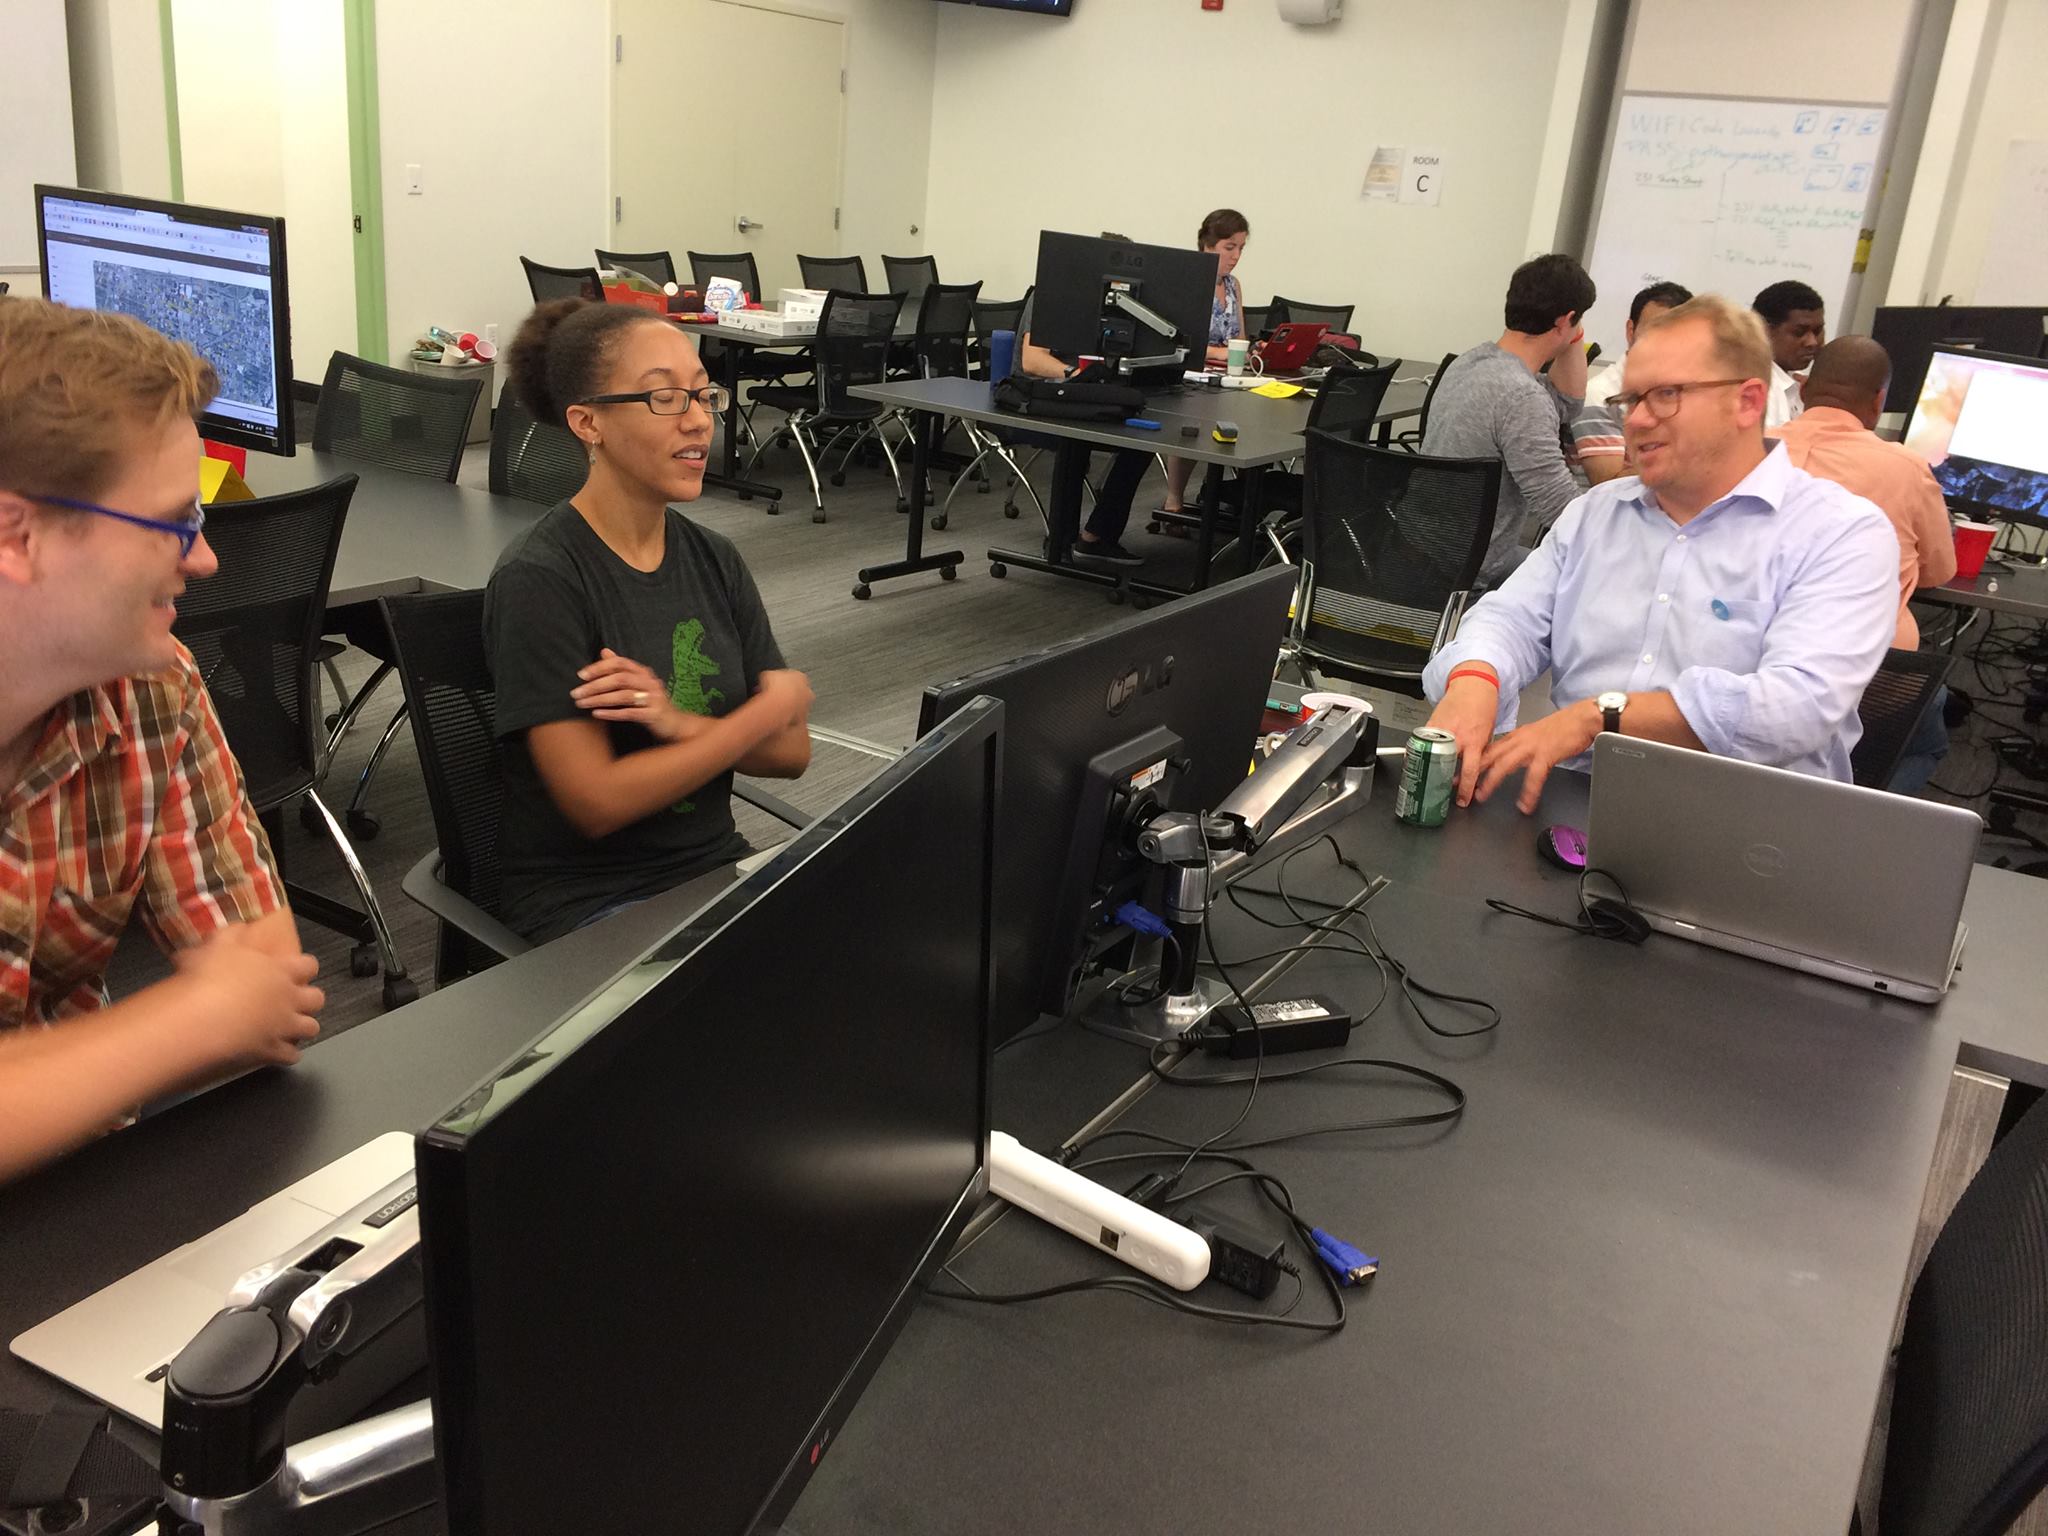
Being an avid wheelman with a life-long interest in the clear presentation of data, I chose the Bicycle Accident project. Dave Mattingly coordinated the project and there were six of us in the group. In experience level and position along the “data pipeline,” we ranged all the way from Dave the Data Commando to a recent Code Louisville graduate. After a brief round of introductions we got to work.
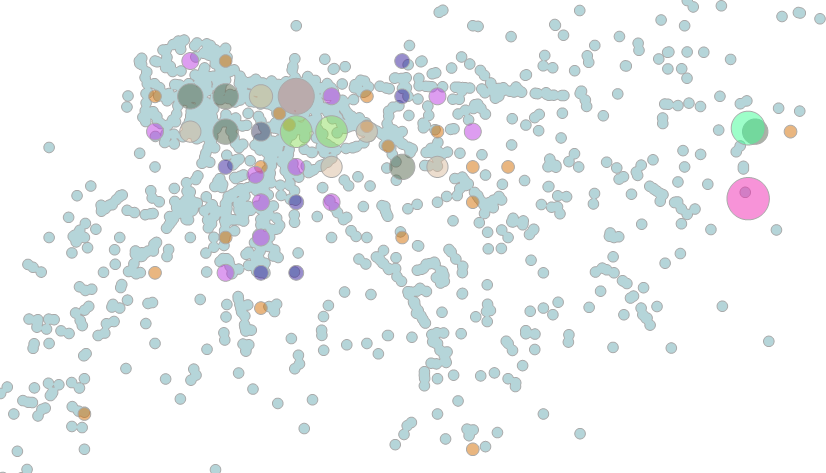
I started out by pulling the data into RStudio and doing some exploratory analysis which included using the ggplot2 and base R visualization packages. As it turned out, there were no deep insights to be had and our goals would be well served by some simple visualizations that would allow Louisville Metro Government to identify problem streets and locations.
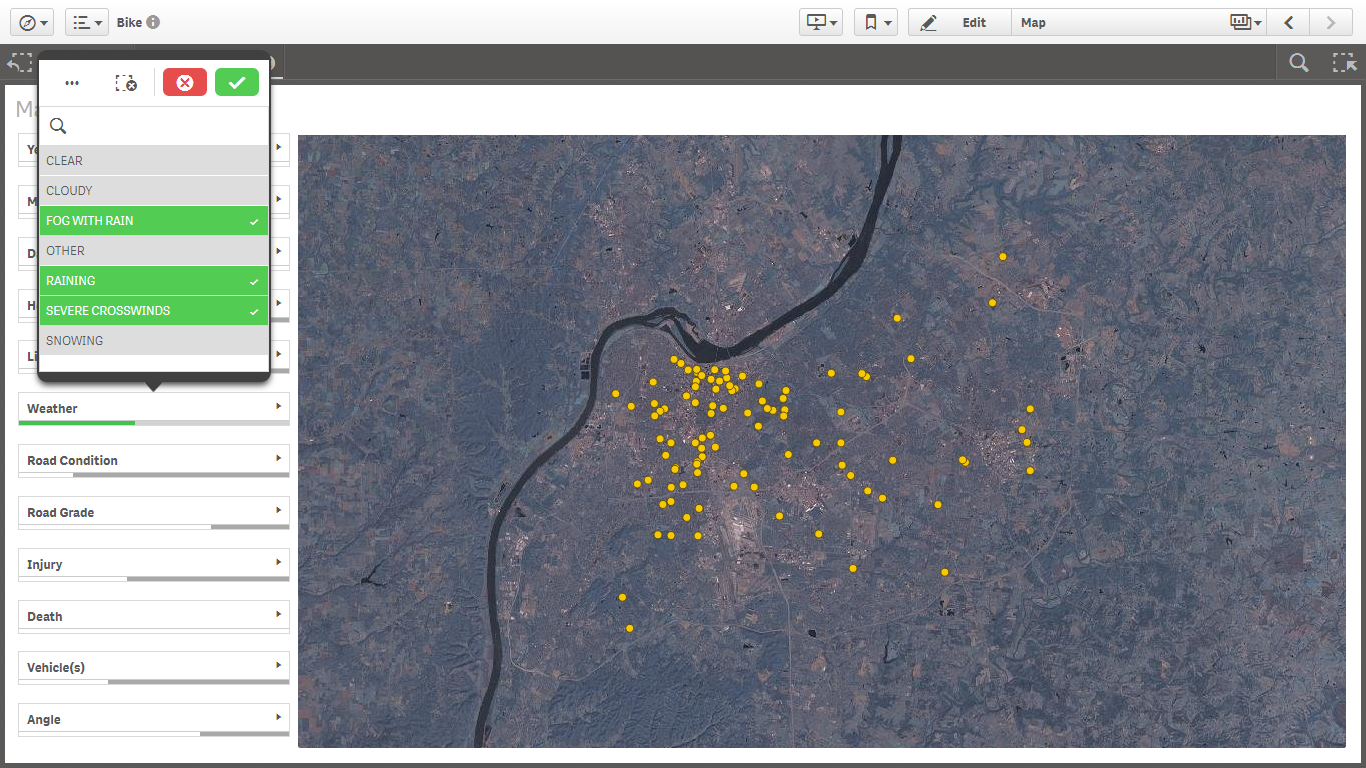
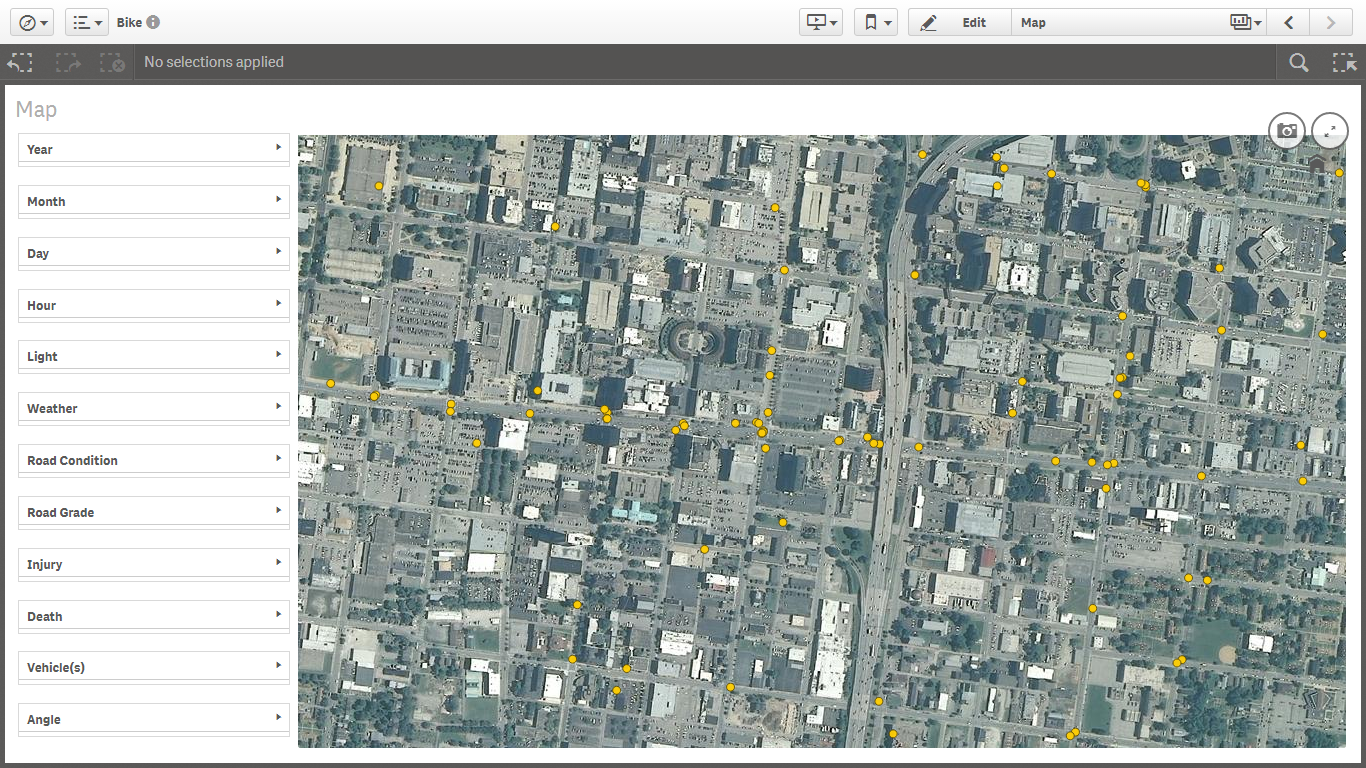
After spending some time developing a map in CartoDB, I decided to switch to Tableau Public. (I was much more familiar with Tableau.) After a few glitches pulling in the map outline and selecting the visual properties, I was able to post a useful map showing the location of bicycle accidents by location, number, type, weather condition, etc. After that, it was a simple matter to post the map on the Tableau Public site.
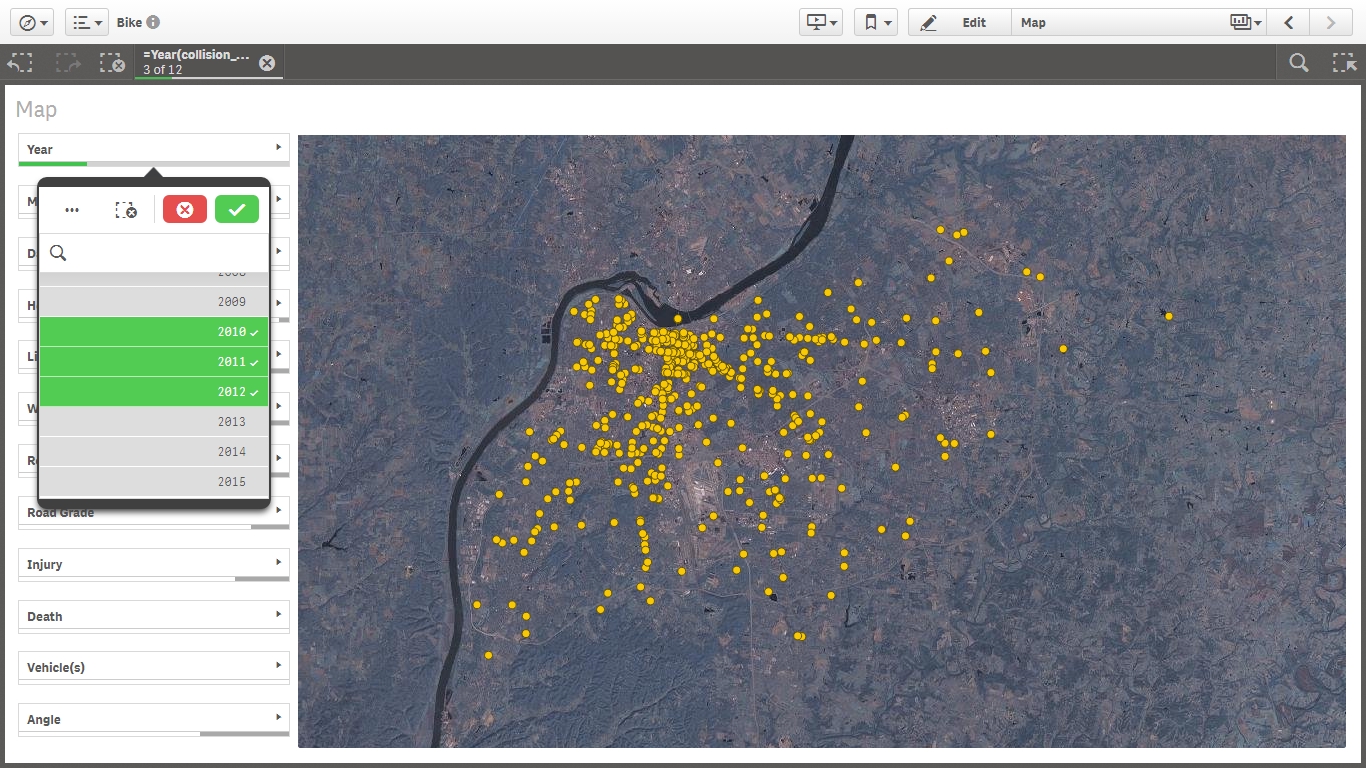
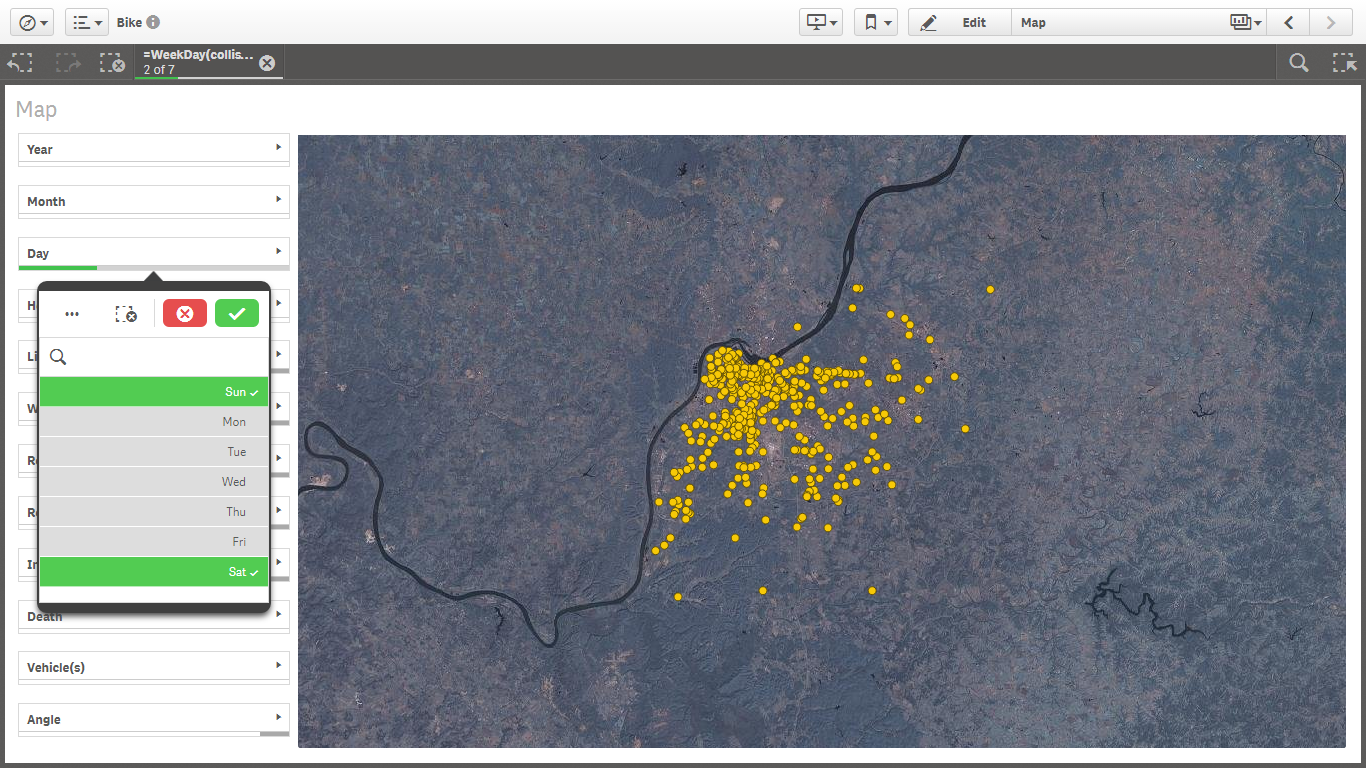
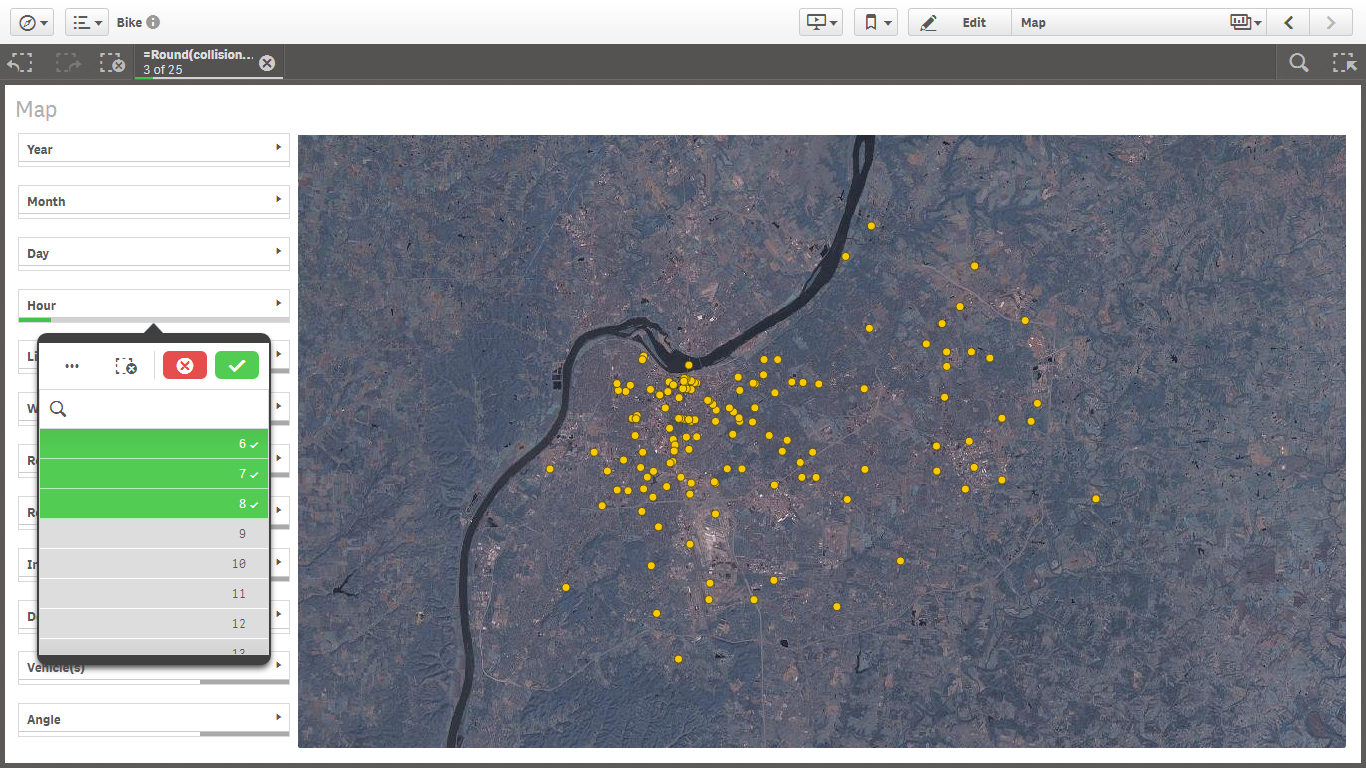
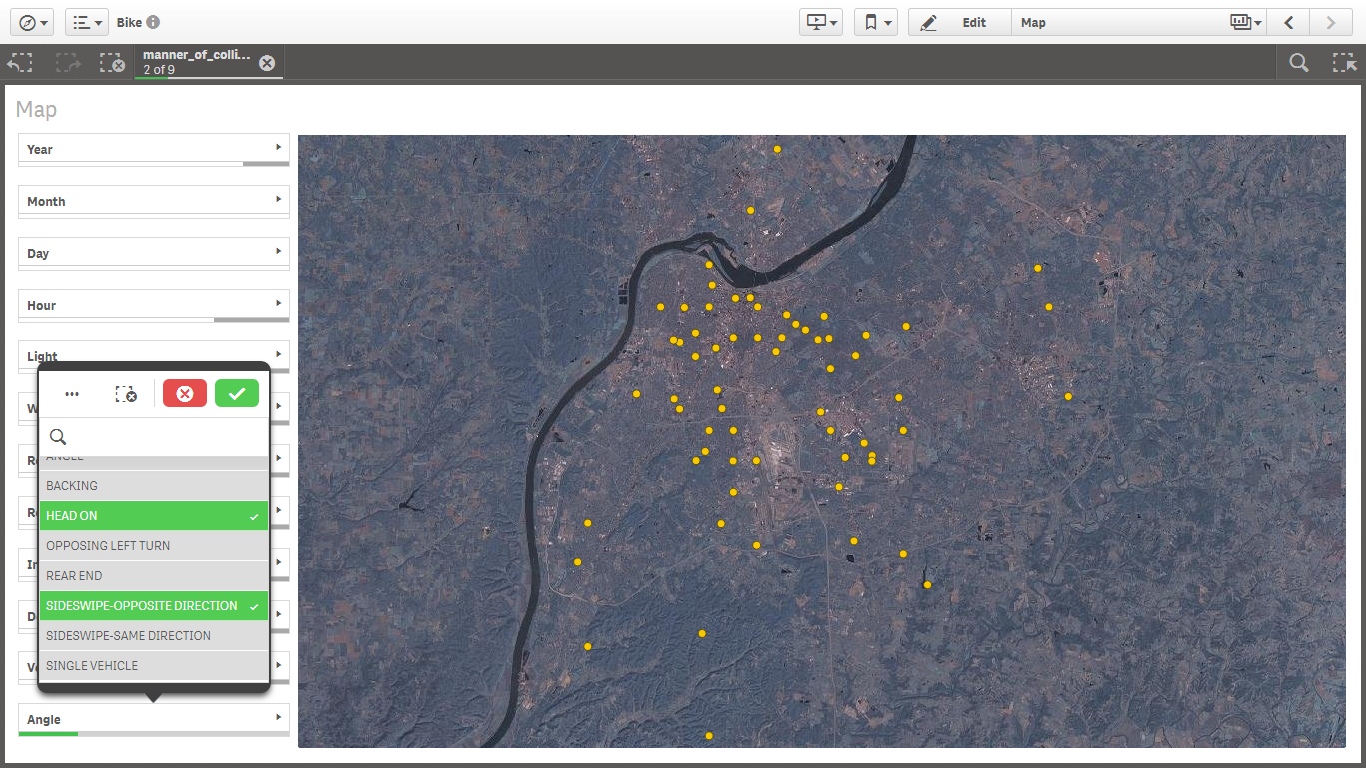
Meanwhile, Dave was hard at work with Qlik Sense and was able to develop a working prototype.
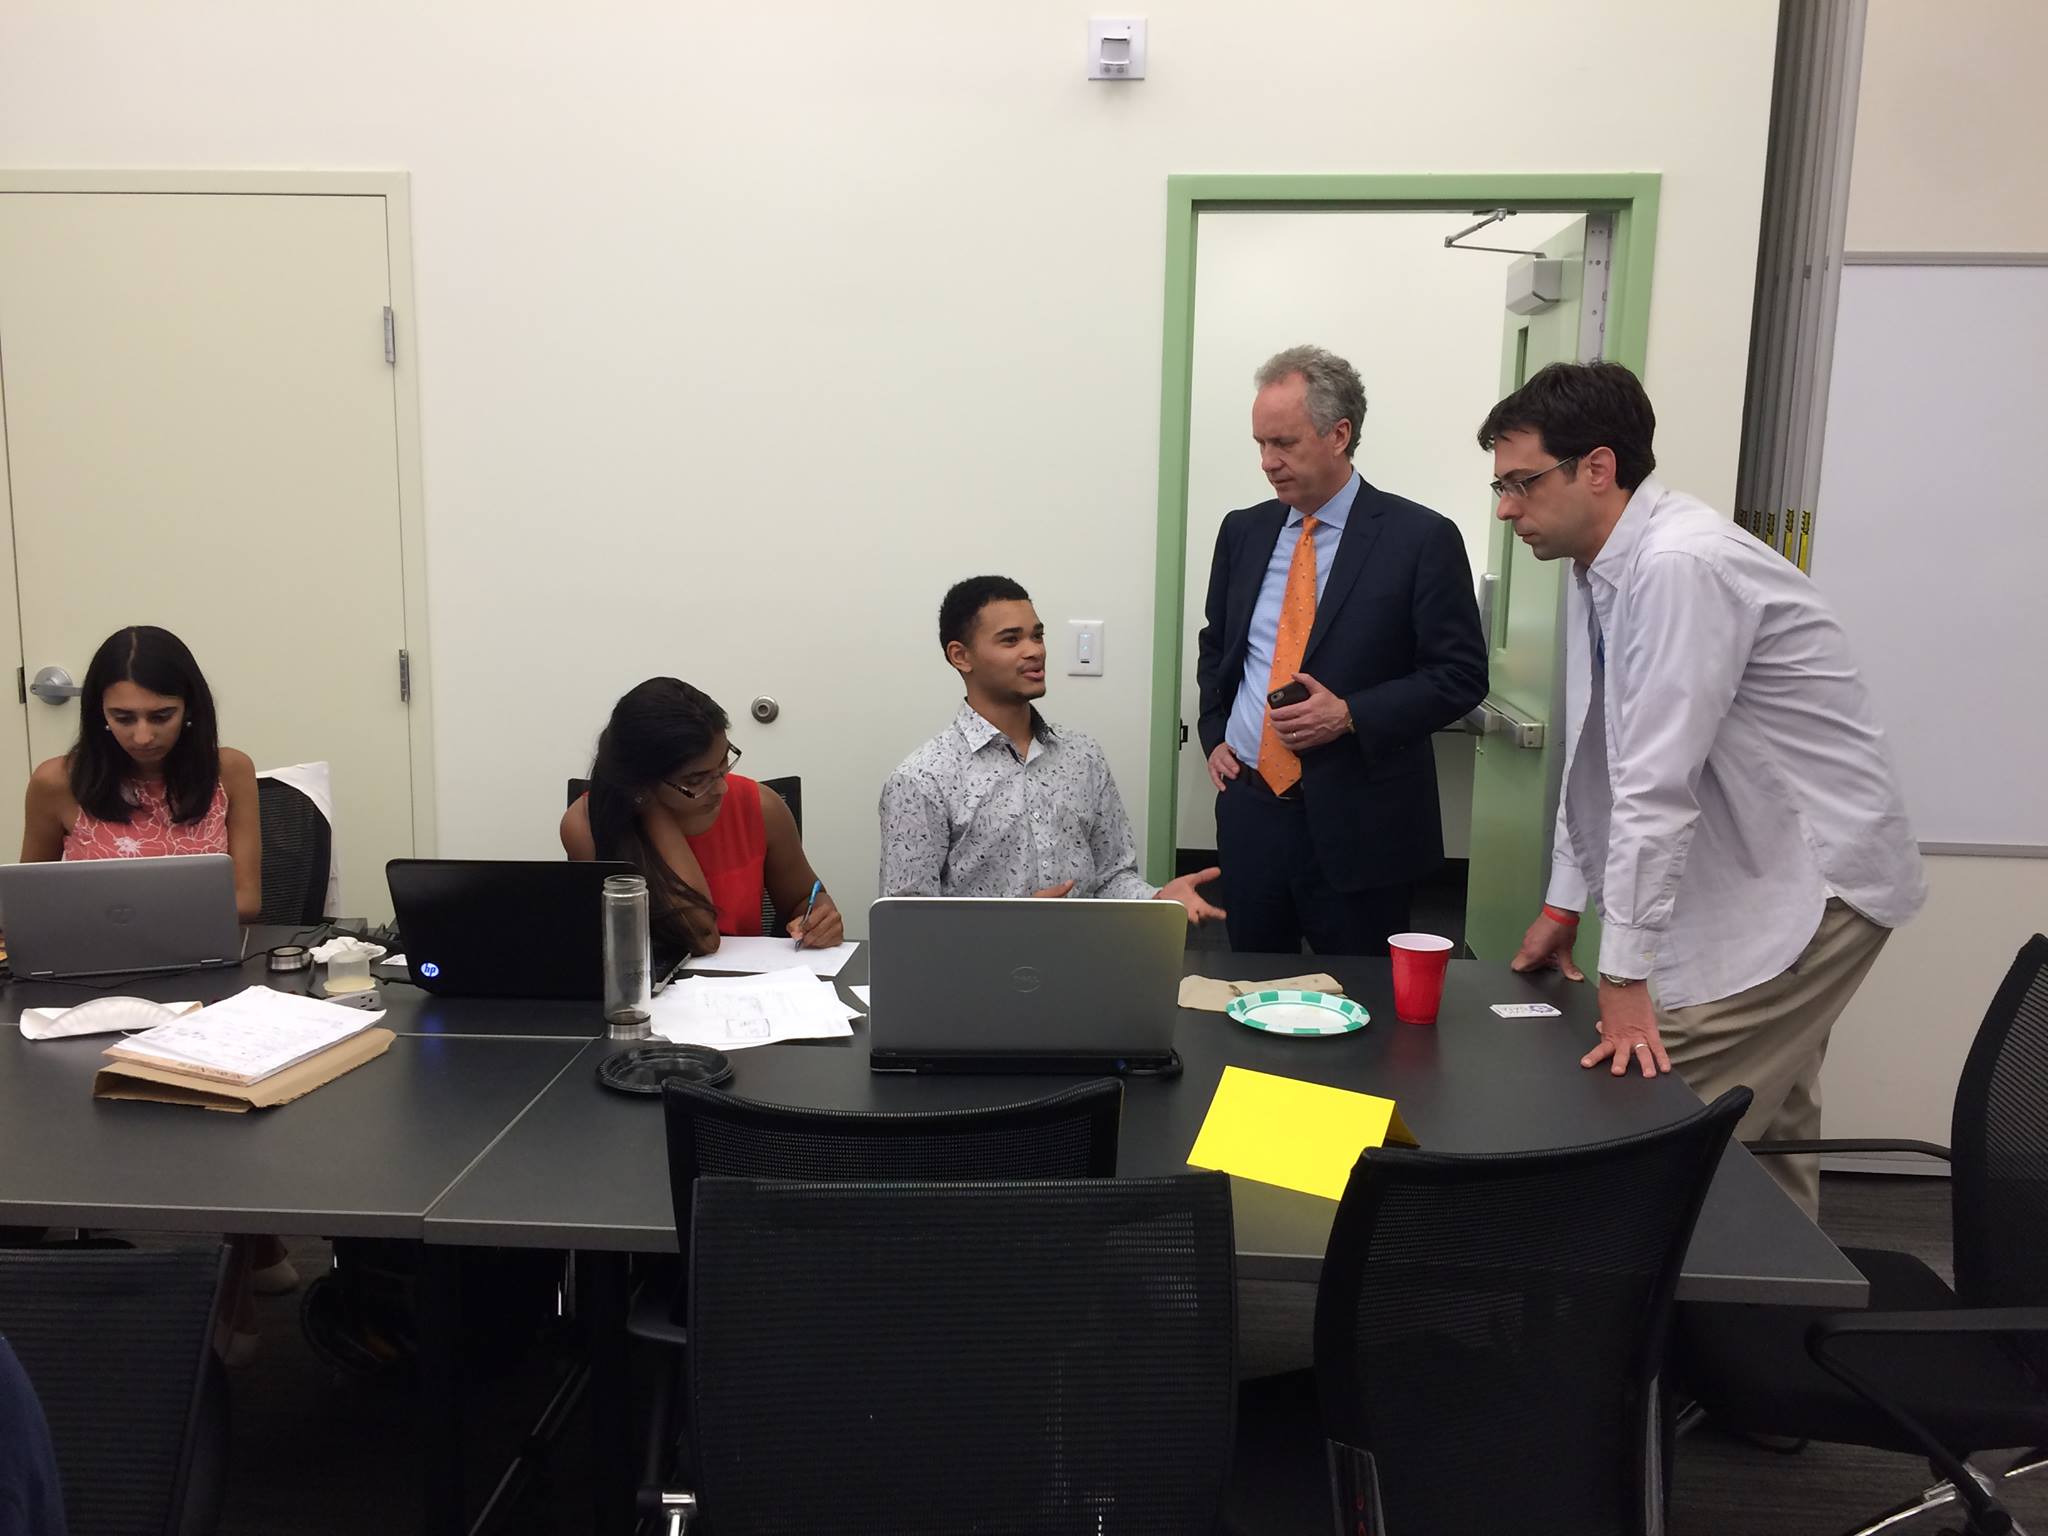
After a working lunch, provided by the sponsors, Louisville Mayor Greg Fisher paid us a visit. Next came some hand shaking and consultations with the individual groups; he then provided appropriate contacts in city government to further the development work for several projects.
We finished with the individual groups giving a summary and in some cases, a demo on what they accomplished. Overall, it was a productive and satisfying day’s work. I’m definitely coming back for the 5th Annual Hack for Change and even some other Hacks as they arise.
Finally, a big thank you to:
- Our generous sponsors and hosts: Code Louisville, Software Guild, Louisville Metro Government Office of Performance Improvement and Innovation, and WFPL
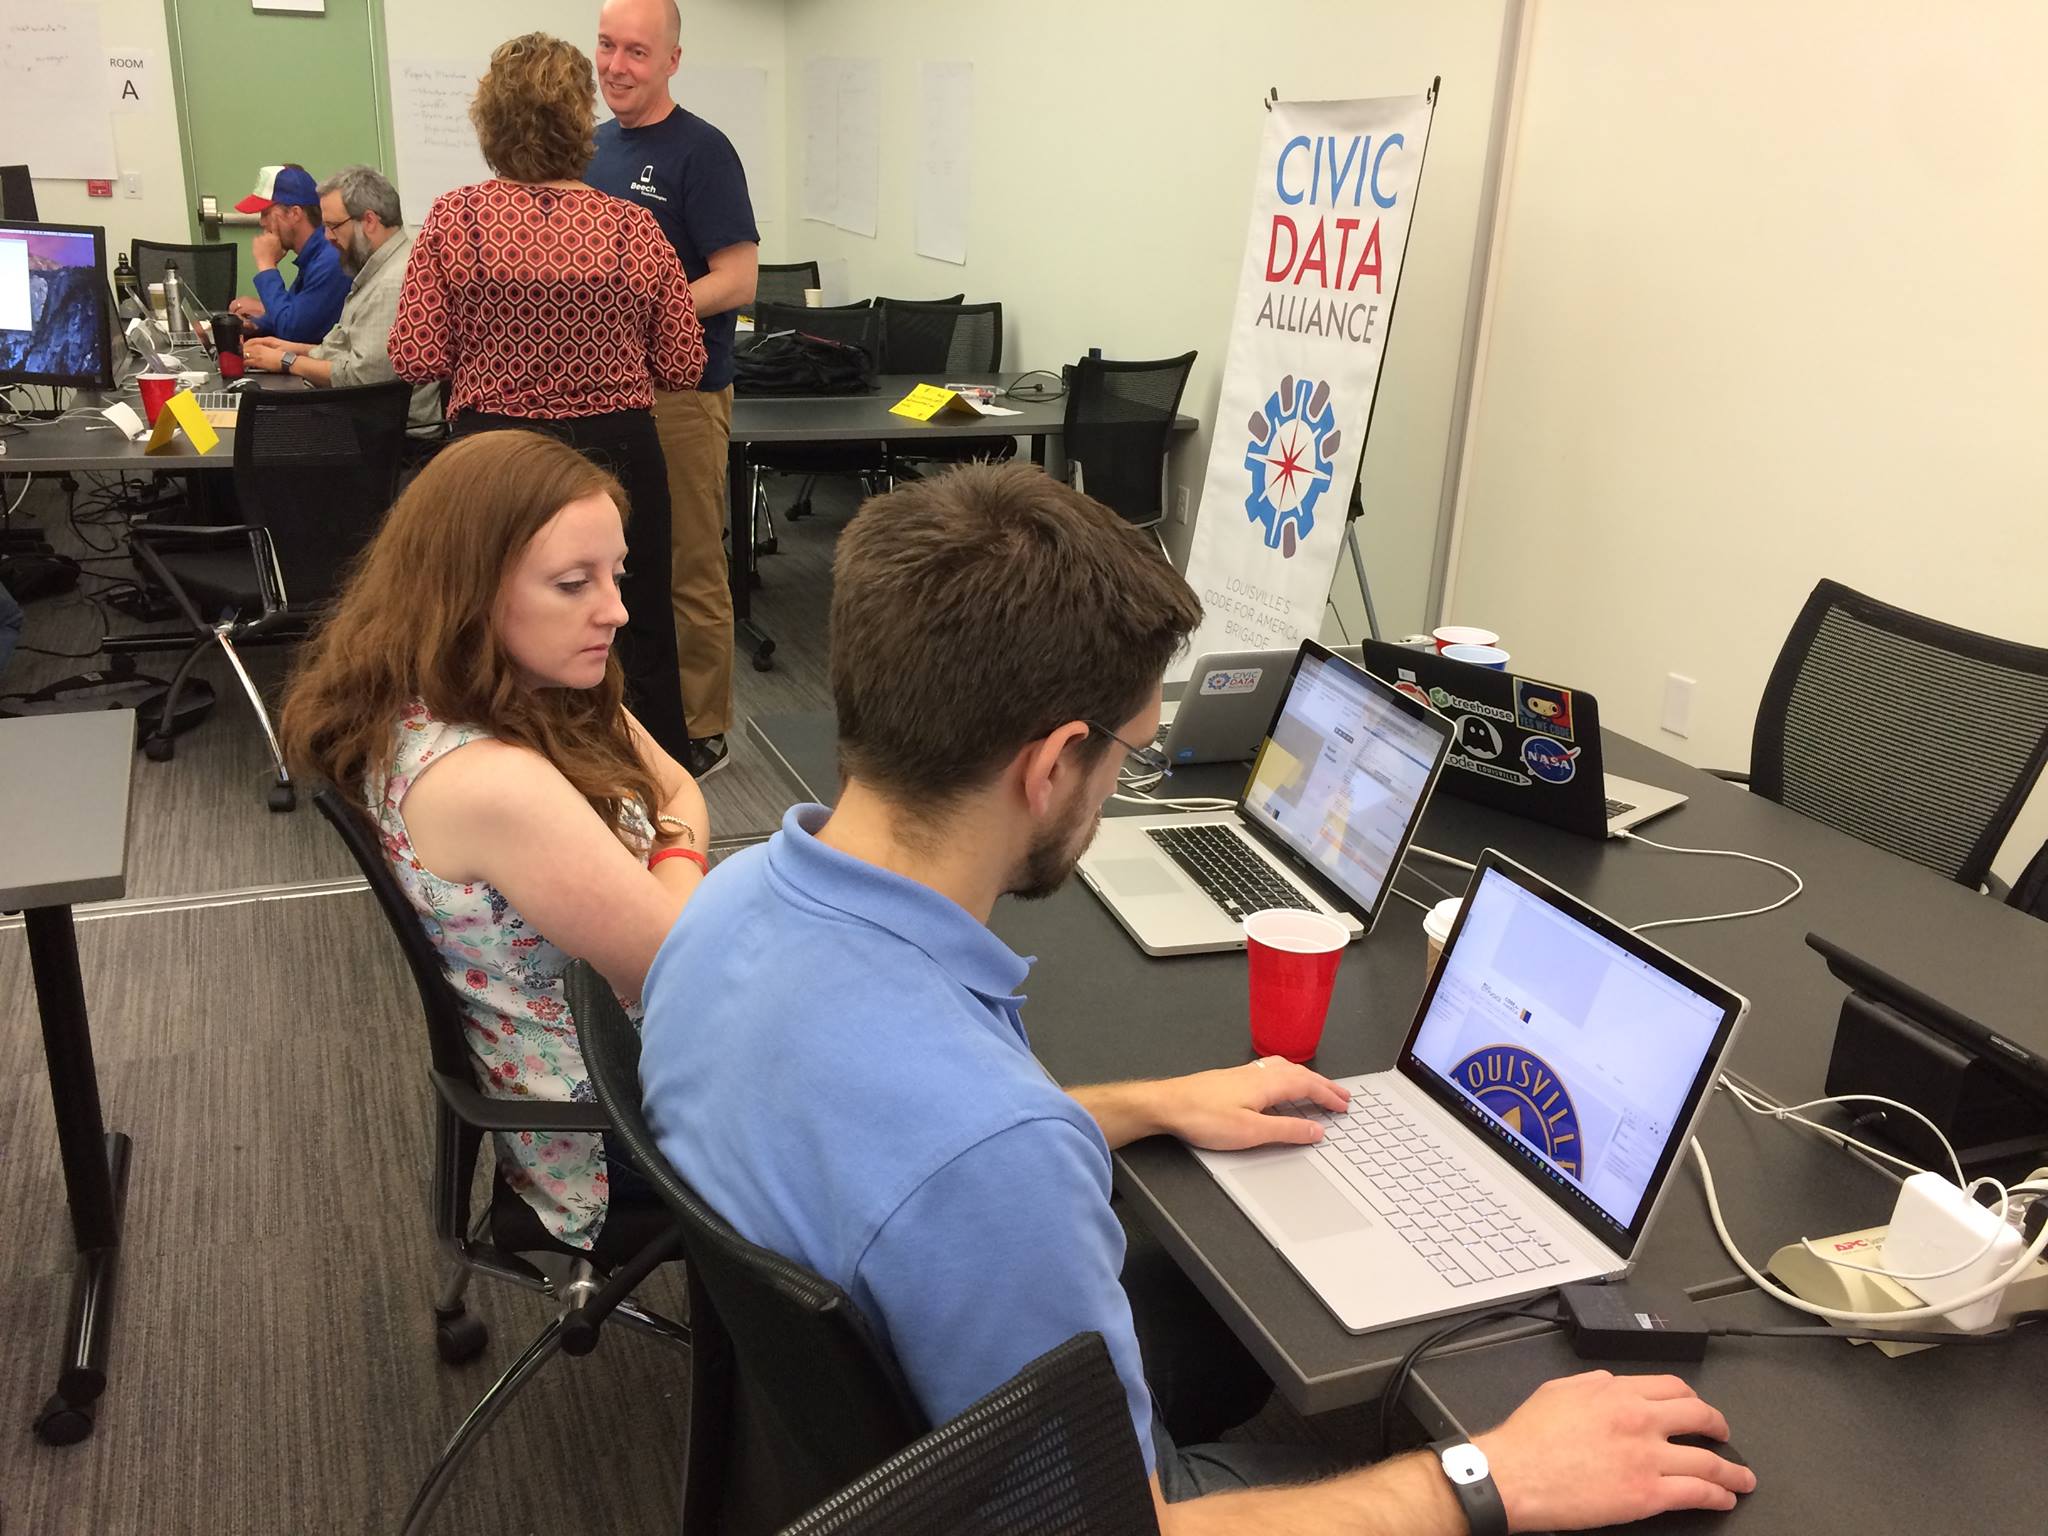
- Civic Data Alliance core members: Michael Schnuerle, Pat Smith, Chris Harrell, Becky Steele
- Government Liaisons: Mayor Greg Fischer, Ted Smith, Ed Blaney
for making the event possible.
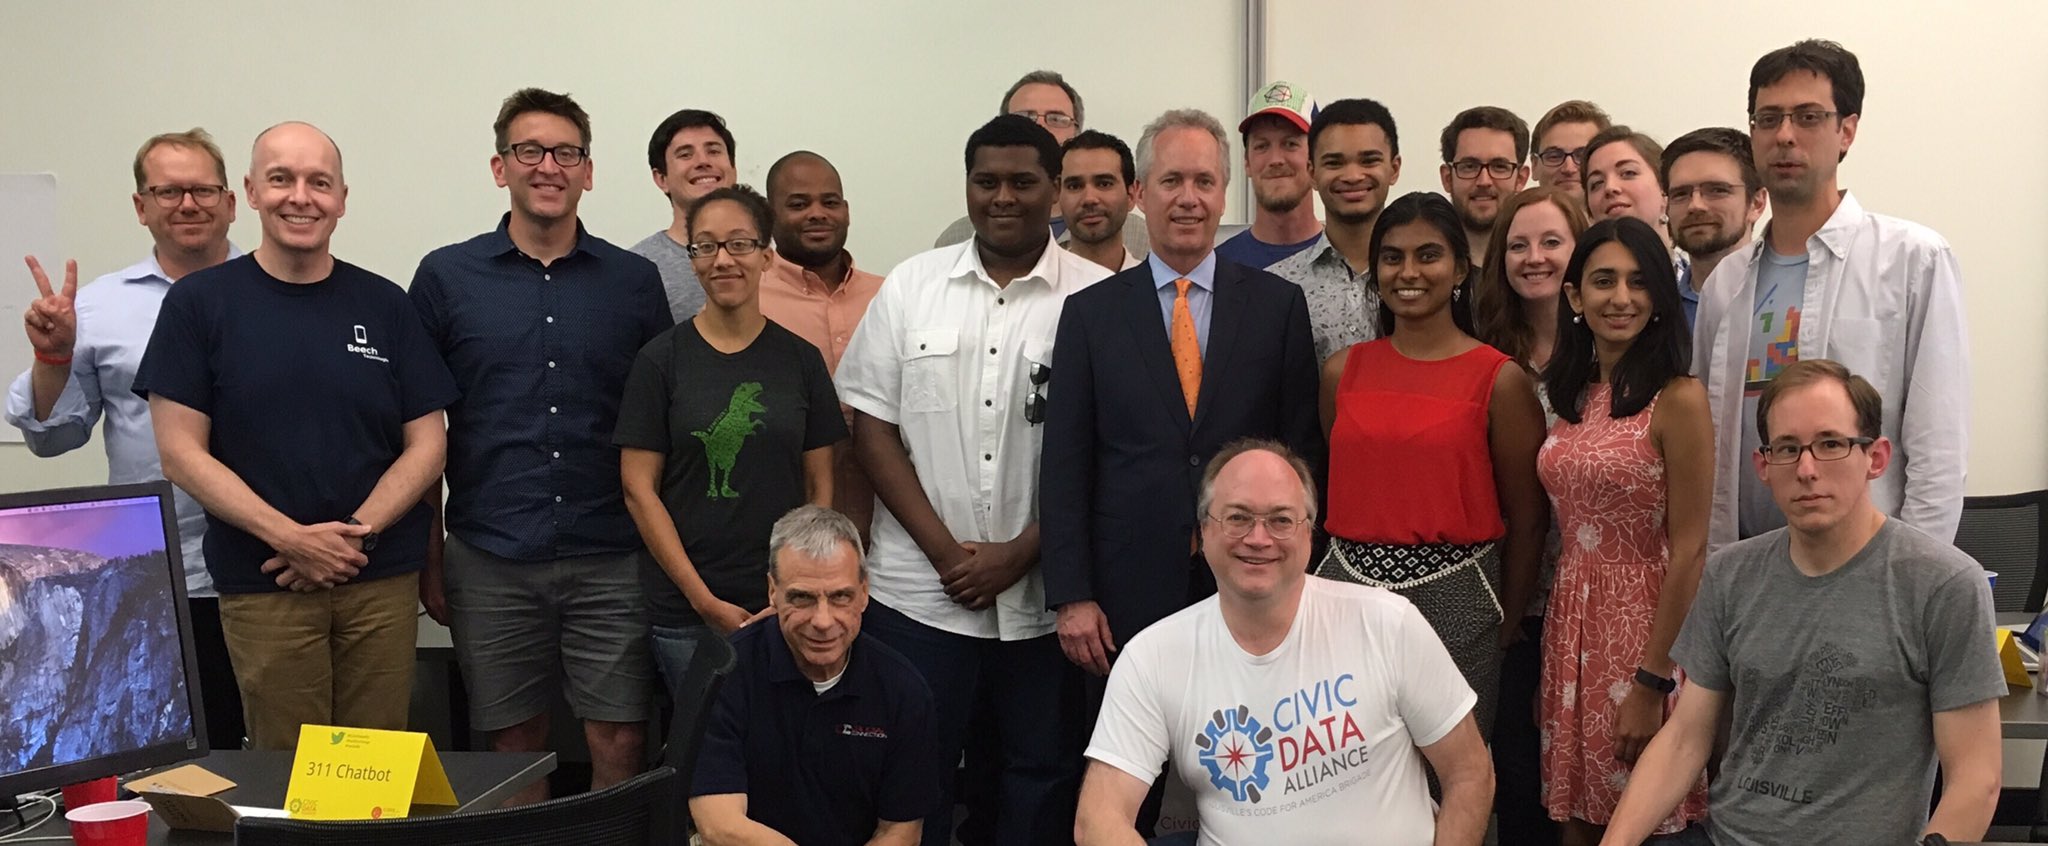
Event Photo Gallery